

The graphing calculator command shown in Figure A generated a set of 400 random integers from 2
Question:
The graphing calculator command shown in Figure A generated a set of 400 random integers from 2 to 24, stored as list L1. The statistical plot in Figure B is a histogram of L1, using a class interval width of 1, starting at 1.5.
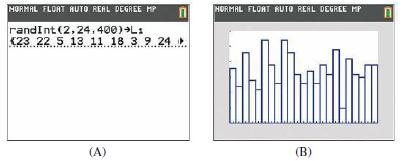
(A) Explain how the window variables can be changed to display a histogram of the same data set using a class interval width of 2, starting at 1.5. A width of 4, starting at 1.5.
(B) Describe the effect of increasing the class interval width on the shape of the histogram.
Step by Step Answer:

This question has not been answered yet.
You can Ask your question!
Related Book For 

Finite Mathematics For Business Economics Life Sciences And Social Sciences
ISBN: 9780134862620
14th Edition
Authors: Raymond Barnett, Michael Ziegler, Karl Byleen, Christopher Stocker
Question Posted:
