New Semester
Started
Get
50% OFF
Study Help!
--h --m --s
Claim Now
Question Answers
Textbooks
Find textbooks, questions and answers
Oops, something went wrong!
Change your search query and then try again
S
Books
FREE
Study Help
Expert Questions
Accounting
General Management
Mathematics
Finance
Organizational Behaviour
Law
Physics
Operating System
Management Leadership
Sociology
Programming
Marketing
Database
Computer Network
Economics
Textbooks Solutions
Accounting
Managerial Accounting
Management Leadership
Cost Accounting
Statistics
Business Law
Corporate Finance
Finance
Economics
Auditing
Tutors
Online Tutors
Find a Tutor
Hire a Tutor
Become a Tutor
AI Tutor
AI Study Planner
NEW
Sell Books
Search
Search
Sign In
Register
study help
mathematics
survey of mathematics
A Survey of Mathematics with Applications 10th edition Allen R. Angel, Christine D. Abbott, Dennis Runde - Solutions
Imagine a very large connected graph that has 400 odd vertices and no even vertices.(a) Does an Euler path exist for this graph? Explain.(b) Does an Euler circuit exist for this graph? Explain.
Imagine a very large connected graph that has two odd vertices and 398 even vertices.(a) Does an Euler path exist for this graph? Explain.(b) Does an Euler circuit exist for this graph? Explain.
Imagine a very large connected graph that has 400 even vertices and no odd vertices.(a) Does an Euler path exist for this graph? Explain. (b) Does an Euler circuit exist for this graph? Explain.
Determine an Euler circuit for the Country Oaks crime stopper group that begins with vertex J followed by vertex F.
Determine an Euler circuit for the Country Oaks crime stopper group that begins with vertex J followed by vertex G.
Determine an Euler circuit for the Country Oaks crime stopper group that begins with vertex B followed by vertex E.
Determine an Euler circuit for the Country Oaks crime stopper group that begins with vertex B followed by vertex A.
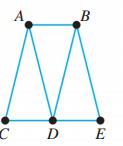
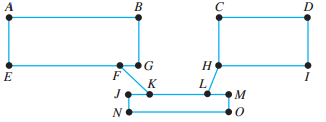
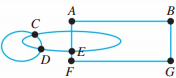
Determine an Euler path for the Phenomenal Phitness Gym that begins in locker room (vertex) A.
Determine an Euler path through the states in the Navy Region Southwest that begins with the state of Utah.
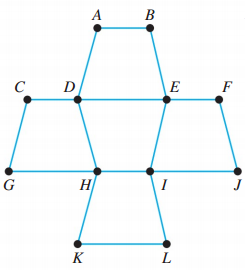
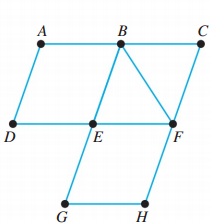
Use Fleury’s algorithm to determine an Euler circuit. A B D Н G K
Use Fleury’s algorithm to determine an Euler circuit. B Н
Use Fleury’s algorithm to determine an Euler circuit. A B D E
Use Fleury’s algorithm to determine an Euler circuit. A Be Н
Use Fleury’s algorithm to determine an Euler circuit. B Н
Use Fleury’s algorithm to determine an Euler circuit. B Н
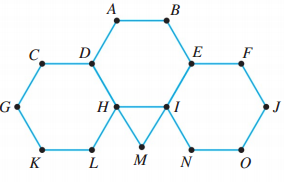
Use Fleury’s algorithm to determine an Euler path. B D C. н N к
Use Fleury’s algorithm to determine an Euler path. De G Н
Use Fleury’s algorithm to determine an Euler path. De OF Н G
Use Fleury’s algorithm to determine an Euler path. A B c D E
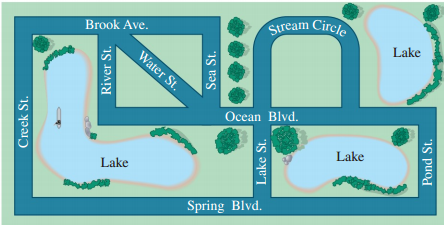
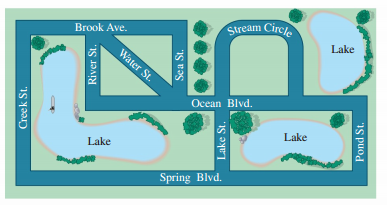
(a) Determine whether the residents in each subdivision will be able to establish a path through their communities so that each street block is walked exactly one time.(b) If yes, where would the residents need to start their walk? Stream Circle Brook Ave. Lake Water St. Ocean Blvd. Lake Lake
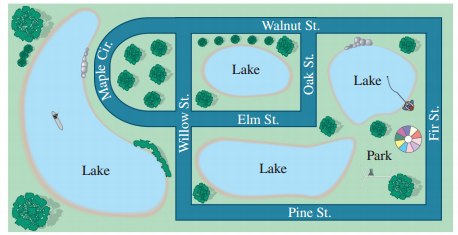
(a) Determine whether the residents in each subdivision will be able to establish a path through their communities so that each street block is walked exactly one time.(b) If yes, where would the residents need to start their walk? Walnut St. Lake Lake Elm St. Park Lake Lake Pine St. Maple Cir
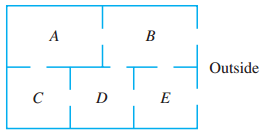
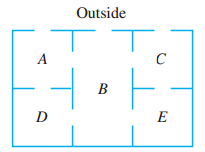
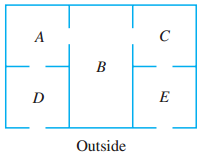
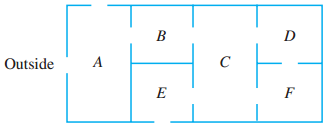
Recall Joe from who runs a gym-cleaning service. Joe is also responsible for locking the doors of four other gyms. (a) Represent each floor plan as a graph. Use the letters shown to label the vertices of the graph and use the letter O to label the vertex that represents the outside of the gym.
Recall Joe from who runs a gym-cleaning service. Joe is also responsible for locking the doors of four other gyms. (a) Represent each floor plan as a graph. Use the letters shown to label the vertices of the graph and use the letter O to label the vertex that represents the outside of the gym.
Recall Joe from who runs a gym-cleaning service. Joe is also responsible for locking the doors of four other gyms. (a) Represent each floor plan as a graph. Use the letters shown to label the vertices of the graph and use the letter O to label the vertex that represents the outside of the gym.
Recall Joe from who runs a gym-cleaning service. Joe is also responsible for locking the doors of four other gyms. (a) Represent each floor plan as a graph. Use the letters shown to label the vertices of the graph and use the letter O to label the vertex that represents the outside of the gym.
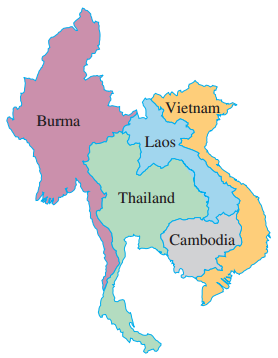
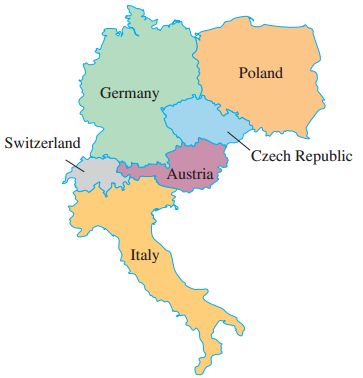
Use each map shown.(a) Represent the map as a graph. Use the letter indicated in parentheses to label vertices of the graph. (b) Determine (state yes or no) whether the graph in part (a) has an Euler path. If yes, give one such Euler path.(c) Determine (state yes or no) whether the graph in
Use each map shown.(a) Represent the map as a graph. Use the letter indicated in parentheses to label vertices of the graph. (b) Determine (state yes or no) whether the graph in part (a) has an Euler path. If yes, give one such Euler path.(c) Determine (state yes or no) whether the graph in
Use each map shown.(a) Represent the map as a graph. Use the letter indicated in parentheses to label vertices of the graph. (b) Determine (state yes or no) whether the graph in part (a) has an Euler path. If yes, give one such Euler path.(c) Determine (state yes or no) whether the graph in
Use each map shown.(a) Represent the map as a graph. Use the letter indicated in parentheses to label vertices of the graph. (b) Determine (state yes or no) whether the graph in part (a) has an Euler path. If yes, give one such Euler path.(c) Determine (state yes or no) whether the graph in
The maps of states that are in other Navy regions are shown. Use these graphs to complete the exercises.Navy Region Southeast(a) Represent the map as a graph. Use the state abbreviations to label the vertices of the graph.(b) Determine (state yes or no) whether the graph in part (a) has an Euler
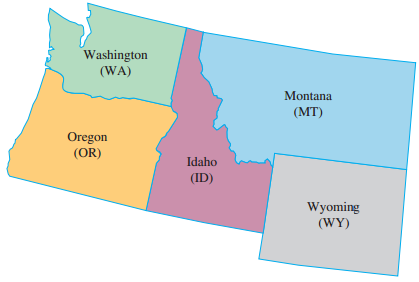
The maps of states that are in other Navy regions are shown. Use these graphs to complete the exercises.Navy Region Northwest.(a) Represent the map as a graph. Use the state abbreviations to label the vertices of the graph.(b) Determine (state yes or no) whether the graph in part (a) has an Euler
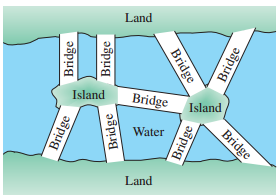
Suppose that the people of Königsberg decide to add several bridges to their city. Two such possibilities are shown.(a) Would the townspeople be able to walk across all the bridges without crossing the same bridge twice?(b) If so, where should they begin and where would they end? Land Island
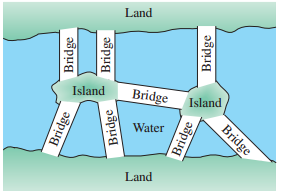
Suppose that the people of Königsberg decide to add several bridges to their city. Two such possibilities are shown.(a) Would the townspeople be able to walk across all the bridges without crossing the same bridge twice?(b) If so, where should they begin and where would they end? Land Island
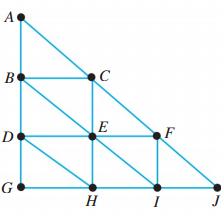
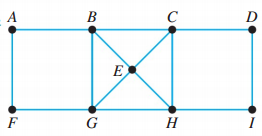
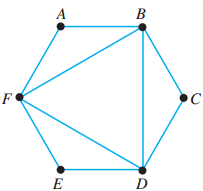
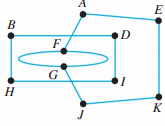
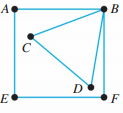
Determine an Euler circuit that begins and ends with vertex F.Use the following graph. E.
Determine an Euler circuit that begins and ends with vertex E.Use the following graph. E.
Determine an Euler circuit that begins and ends with vertex D.Use the following graph. E.
Determine an Euler circuit that begins and ends with vertex C.Use the following graph. E.
Determine an Euler circuit that begins and ends with vertex B.Use the following graph. E.
Determine an Euler circuit that begins and ends with vertex A.Use the following graph. E.
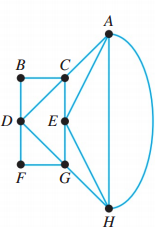
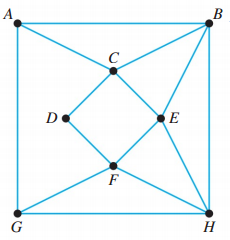
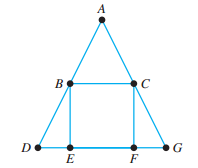
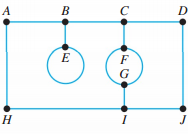
Is it possible to determine an Euler path that begins with vertex A?Use the following graph. A B DO
Is it possible to determine an Euler circuit for this graph? Explain.Use the following graph. A B DO
Determine an Euler path that begins with vertex F.Use the following graph. A B DO
Determine an Euler path that begins with vertex E.Use the following graph. A B DO
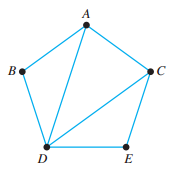
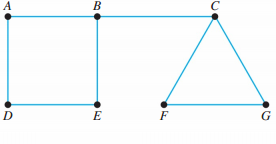
Is it possible to determine an Euler circuit for this graph? Explain.Use the following graph. A Be
Is it possible to determine an Euler path that begins with vertex B? Explain.Use the following graph. A Be
Determine an Euler path that begins with vertex C.Use the following graph. A Be
Determine an Euler path that begins with vertex A.Use the following graph. A Be
Fill in the blanks with an appropriate word, phrase, or symbol(s).If a connected graph has exactly two odd vertices, A and B, then each Euler path must begin at vertex A and end at vertex _________________, or begin at vertex Band end at vertex A.
Fill in the blanks with an appropriate word, phrase, or symbol(s).A connected graph has neither an Euler path nor an Euler circuit, if the graph has more than two ____________ vertices.
Fill in the blanks with an appropriate word, phrase, or symbol(s).A truth table for a compound statement with a) One distinct simple statement will have cases. b) Two distinct simple statements will have cases. c) Three distinct simple statements will have cases.
Fill in the blanks with an appropriate word, phrase, or symbol(s).A connected graph has at least one Euler path that is also an Euler circuit, if the graph has _______________ odd vertices.
Fill in the blanks with an appropriate word, phrase, or symbol(s).The conjunction p ∧ q is true only when both p and q are __________.
Read the Recreational Mathematics. Belinda, Dennis, Jeff, Kristie, Lucy, and Mike are all on Facebook. The following pairs of people are friends: Belinda and Dennis, Belinda and Kristie, Belinda and Lucy, Dennis and Kristie, Dennis and Lucy, Dennis and Mike, Jeff and Lucy, Kristie and Lucy, and
Draw four different graphs and then for each graph:What conclusion relating the sum of the degrees of vertices to the number of edges can you draw from this exercise? Explain why this conclusion is true.
Attempt to draw a graph that has an odd number of odd vertices. What conclusion can you draw from this exercise?
A connected graph is shown. Identify any bridges in each graph. A OF Н
A connected graph is shown. Identify any bridges in each graph. Н
A connected graph is shown. Identify any bridges in each graph. D A Н
A connected graph is shown. Identify any bridges in each graph. E
Determine whether the graph shown is connected or disconnected. н
Determine whether the graph shown is connected or disconnected. A
Determine whether the graph shown is connected or disconnected. •F
Determine whether the graph shown is connected or disconnected. A. D. 'F G.
The map of the Crescent Lakes subdivision in Essex County, Maryland, is shown below. Use a graph to represent the streets in this subdivision. Use letters to label the vertices. Stream Circl. Lake Brook Ave. Water St. Ocean Blvd. Lake Lake Spring Blvd. Creek St. River St. Sea St. Lake St. Pond St.
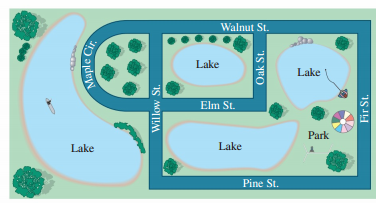
The map of the Tree Tops subdivision in Prince George County, Virginia, is shown below. Use a graph to represent the streets in this subdivision. Use letters to label the vertices. Walnut St. ৯ Lake Lake Elm St. Park Lake Lake Pine St. Maple Cir Willow St. Oak St. Fir St.
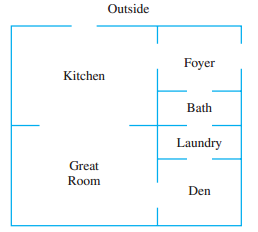
The drawing below shows the floor plan of the Bougainvillea model home offered by Alstrom Builders of Waco, Texas. Place vertex O near the bottom of the graph.Use a graph to represent the floor plan shown. In each graph, use the letter O to represent the outside of the building. Den Recreation Room
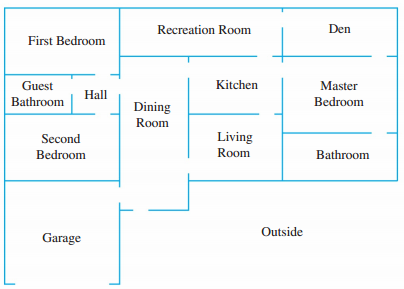
The drawing below shows the floor plan of the first floor of the Oleander model home offered by Nisely Builders of Albuquerque, New Mexico. Place vertex O near the bottom of the graph.Use a graph to represent the floor plan shown. In each graph, use the letter O to represent the outside of the
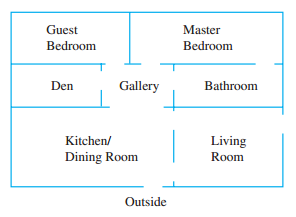
The drawing below shows the floor plan of the Sun Valley model home offered by Wubben Builders of Pocatello, Idaho. Place vertex O near the bottom of the graph.Use a graph to represent the floor plan shown. In each graph, use the letter O to represent the outside of the building. Guest Master
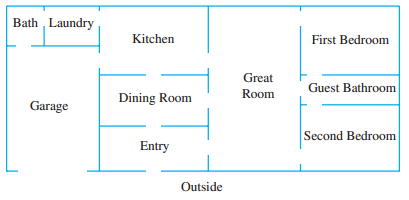
The drawing below shows the first-floor plan of the Aloha model home offered by the Ghiselin Family Construction Company of Woonsocket, Rhode Island. Place vertex O near the top of the graph.Use a graph to represent the floor plan shown. In each graph, use the letter O to represent the outside of
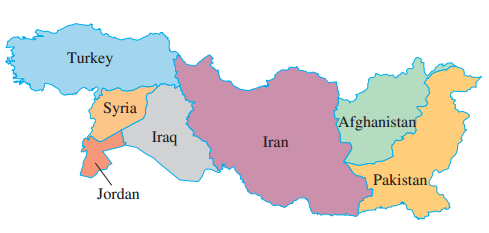
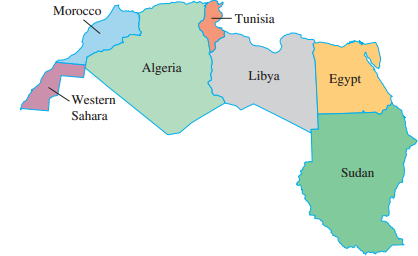
The map below shows the countries of Algeria (A), Egypt (E), Libya (L), Morocco (M), Sudan (S), Tunisia (T), and Western Sahara (W). Represent the map as a graph where each vertex represents a country and each edge represents a common border between the countries. Use the letters indicated in
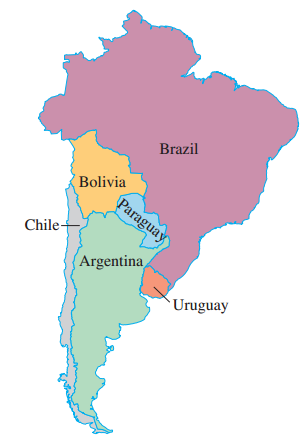
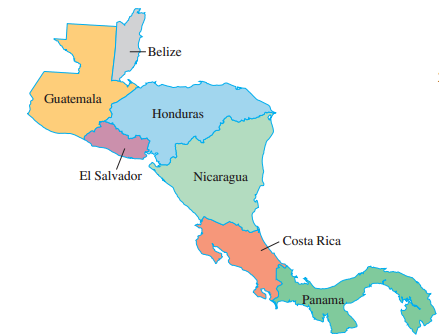
The map below shows the countries of Belize (B), Costa Rica (C), El Salvador (E), Guatemala (G), Honduras (H), Nicaragua (N), and Panama (P). Represent the map as a graph where each vertex represents a country and each edge represents a common border between the countries. Use the letters indicated
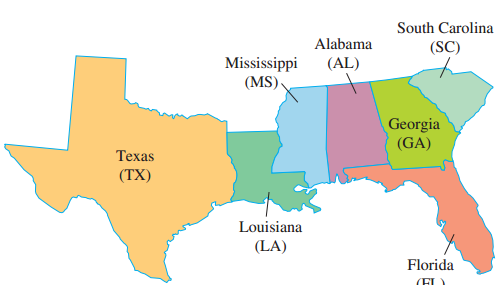
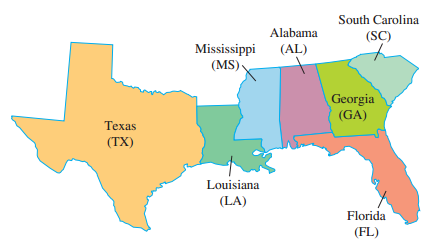
The maps of states that are in other Navy regions are shown. Represent each map as a graph where each vertex represents a state and each edge represents a common border between the states. Use the state abbreviations to label the vertices of the graph.Navy Region Southeast. South Carolina Alabama
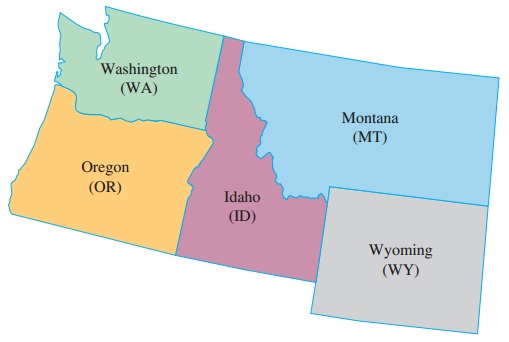
The maps of states that are in other Navy regions are shown. Represent each map as a graph where each vertex represents a state and each edge represents a common border between the states. Use the state abbreviations to label the vertices of the graph.Navy Region Northwest. Washington (WA) Montana
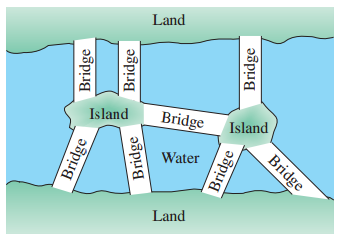
Suppose that the people of Königsberg decide to add several bridges to their city. Two such possibilities are shown. Create graphs that would represent the Königsberg bridge problem with these new bridges. Land Bridge Island Island Water Land Bridge Bridge Bridge Bridge Bridge Bridge Bridge Bridge
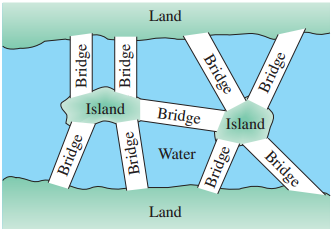
Suppose that the people of Königsberg decide to add several bridges to their city. Two such possibilities are shown. Create graphs that would represent the Königsberg bridge problem with these new bridges. Land Island Bridge Island Water Land əspug Bridge Bridge Bridge aspug Bridge
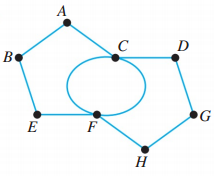
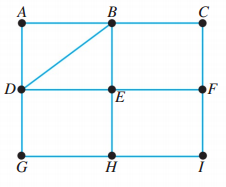
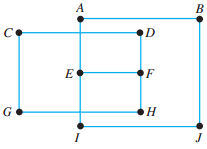
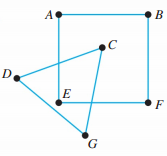
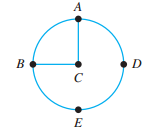
On the graph, can you determine a circuit that includes all of the vertices, other than the beginning and ending vertex, exactly one time? If so, determine one such circuit.Use the graph below to answer the question. A D
On the graph, can you determine a circuit that includes all of the edges exactly one time? If so, determine one such circuit.Use the graph below to answer the question. A D
On the graph, is it possible to determine a path that begins with vertex C, contains all of the edges exactly once, and ends with vertex B? If so, determine one such path.Use the graph below to answer the following questions. A D
On the graph, is it possible to determine a path that begins with vertex A, contains all of the edges exactly once, and ends with vertex B? If so, determine one such path.Use the graph below to answer the question. A D
Is A, D, E, B, A, C, B a circuit? Explain.Use the graph below to answer the question. A D
Use the graph below to answer the following questions.Is A, B, C, D, E a path? Explain. A D
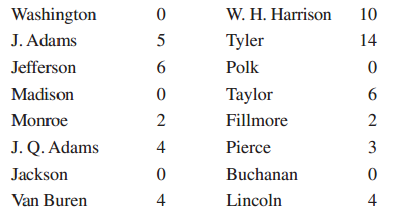
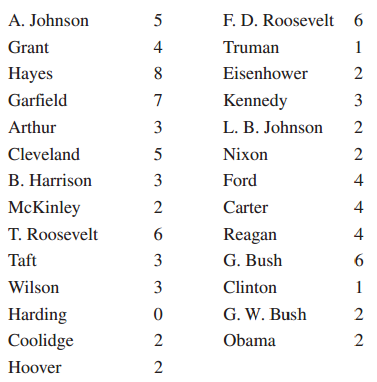
Use the following list which shows the names of the 43 U.S. presidents and the number of children in their families.Does this distribution appear to be normal? Explain. W. H. Harrison Washington J. Adams 10 5 Tyler 14 Jefferson Polk Madison Taylor Monroe Fillmore 2 J. Q. Adams 4 Pierce 3 Jackson
Use the following list which shows the names of the 43 U.S. presidents and the number of children in their families.Construct a frequency polygon of the frequency distribution. W. H. Harrison Washington J. Adams 10 5 Tyler 14 Jefferson Polk Madison Taylor Monroe Fillmore 2 J. Q. Adams 4 Pierce 3
Use the following list which shows the names of the 43 U.S. presidents and the number of children in their families.Construct a histogram of the frequency distribution. W. H. Harrison Washington J. Adams 10 5 Tyler 14 Jefferson Polk Madison Taylor Monroe Fillmore 2 J. Q. Adams 4 Pierce 3 Jackson
Use the following list which shows the names of the 43 U.S. presidents and the number of children in their families.Construct a frequency distribution; let the first class be 0 –1. W. H. Harrison Washington J. Adams 10 5 Tyler 14 Jefferson Polk Madison Taylor Monroe Fillmore 2 J. Q. Adams 4
Use the following list which shows the names of the 43 U.S. presidents and the number of children in their families.Determine the following.Standard deviation (round the mean to the nearest tenth). W. H. Harrison Washington J. Adams 10 5 Tyler 14 Jefferson Polk Madison Taylor Monroe Fillmore 2 J.
Use the following list which shows the names of the 43 U.S. presidents and the number of children in their families.Determine the following.Range. W. H. Harrison Washington J. Adams 10 5 Tyler 14 Jefferson Polk Madison Taylor Monroe Fillmore 2 J. Q. Adams 4 Pierce 3 Jackson Buchanan Van Buren 4
Use the following list which shows the names of the 43 U.S. presidents and the number of children in their families.Determine the following.Midrange. W. H. Harrison Washington J. Adams 10 5 Tyler 14 Jefferson Polk Madison Taylor Monroe Fillmore 2 J. Q. Adams 4 Pierce 3 Jackson Buchanan Van Buren 4
Use the following list which shows the names of the 43 U.S. presidents and the number of children in their families.Determine the following.Median. W. H. Harrison Washington J. Adams 10 5 Tyler 14 Jefferson Polk Madison Taylor Monroe Fillmore 2 J. Q. Adams 4 Pierce 3 Jackson Buchanan Van Buren 4
Use the following list which shows the names of the 43 U.S. presidents and the number of children in their families.Determine the following.Mode. W. H. Harrison Washington J. Adams 10 5 Tyler 14 Jefferson Polk Madison Taylor Monroe Fillmore 2 J. Q. Adams 4 Pierce 3 Jackson Buchanan Van Buren 4
Use the following list which shows the names of the 43 U.S. presidents and the number of children in their families.Determine the following.Mean. W. H. Harrison Washington J. Adams 10 5 Tyler 14 Jefferson Polk Madison Taylor Monroe Fillmore 2 J. Q. Adams 4 Pierce 3 Jackson Buchanan Van Buren 4
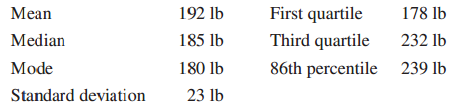
What weight represents 1.8 standard deviations below the mean?Use the data which was obtained from a study of the weights of adult men. 192 lb 185 lb 180 lb 23 lb First quartile 178 lb Mean 232 lb Median Third quartile 86th percentile 239 lb Mode Standard deviation
What weight represents two standard deviations above the mean?Use the data which was obtained from a study of the weights of adult men. 192 lb 185 lb 180 lb 23 lb First quartile 178 lb Mean 232 lb Median Third quartile 86th percentile 239 lb Mode Standard deviation
If 100 men were surveyed, what is the total weight of all the men?Use the data which was obtained from a study of the weights of adult men. 192 lb 185 lb 180 lb 23 lb First quartile 178 lb Mean 232 lb Median Third quartile 86th percentile 239 lb Mode Standard deviation
About what percent of those surveyed weighed more than 239 lb?Use the data which was obtained from a study of the weights of adult men. 192 lb 185 lb 180 lb 23 lb First quartile 178 lb Mean 232 lb Median Third quartile 86th percentile 239 lb Mode Standard deviation
About what percent of those surveyed weighed less than 178 lb?Use the data which was obtained from a study of the weights of adult men. 192 lb 185 lb 180 lb 23 lb First quartile 178 lb Mean 232 lb Median Third quartile 86th percentile 239 lb Mode Standard deviation
About what percent of those surveyed weighed more than 232 lb?Use the data which was obtained from a study of the weights of adult men. 192 lb 185 lb 180 lb 23 lb First quartile 178 lb Mean 232 lb Median Third quartile 86th percentile 239 lb Mode Standard deviation
What weight did half of those surveyed exceed?Use the data which was obtained from a study of the weights of adult men. 192 lb 185 lb 180 lb 23 lb First quartile 178 lb Mean 232 lb Median Third quartile 86th percentile 239 lb Mode Standard deviation
What is the most common weight?Use the data which was obtained from a study of the weights of adult men. 192 lb 185 lb 180 lb 23 lb First quartile 178 lb Mean 232 lb Median Third quartile 86th percentile 239 lb Mode Standard deviation
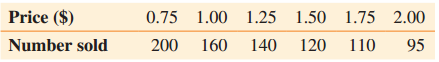
For six weeks, Ace Hardware recorded the price of a particular item and the corresponding sales of that item as shown in the table below.(a) Construct a scatter diagram with price on the horizontal axis.(b) Use the scatter diagram in part (a) to determine whether you believe that a correlation
Showing 700 - 800
of 6427
1
2
3
4
5
6
7
8
9
10
11
12
13
14
15
Last
Step by Step Answers