New Semester
Started
Get
50% OFF
Study Help!
--h --m --s
Claim Now
Question Answers
Textbooks
Find textbooks, questions and answers
Oops, something went wrong!
Change your search query and then try again
S
Books
FREE
Study Help
Expert Questions
Accounting
General Management
Mathematics
Finance
Organizational Behaviour
Law
Physics
Operating System
Management Leadership
Sociology
Programming
Marketing
Database
Computer Network
Economics
Textbooks Solutions
Accounting
Managerial Accounting
Management Leadership
Cost Accounting
Statistics
Business Law
Corporate Finance
Finance
Economics
Auditing
Tutors
Online Tutors
Find a Tutor
Hire a Tutor
Become a Tutor
AI Tutor
AI Study Planner
NEW
Sell Books
Search
Search
Sign In
Register
study help
mathematics
survey of mathematics
A Survey of Mathematics with Applications 10th edition Allen R. Angel, Christine D. Abbott, Dennis Runde - Solutions
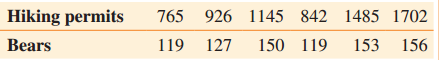
The following table shows the number of hiking permits issued for a specific trail at Yellowstone National Park for selected years and the corresponding number of bears sighted by the hikers on that trail.(a) Construct a scatter diagram with hiking permits on the horizontal axis. (b) Use the
Assume that the amount of time to prepare and deliver a pizza from Pepe’s Pizza is normally distributed with a mean of 20 minutes and standard deviation of 5 minutes. Determine the percent of pizzas that were prepared and delivered.If Pepe’s Pizza advertises that the pizza is free if it takes
Assume that the amount of time to prepare and deliver a pizza from Pepe’s Pizza is normally distributed with a mean of 20 minutes and standard deviation of 5 minutes. Determine the percent of pizzas that were prepared and delivered.Between 22 and 28 minutes.
Assume that the amount of time to prepare and deliver a pizza from Pepe’s Pizza is normally distributed with a mean of 20 minutes and standard deviation of 5 minutes. Determine the percent of pizzas that were prepared and delivered.In less than 18 minutes.
Assume that the amount of time to prepare and deliver a pizza from Pepe’s Pizza is normally distributed with a mean of 20 minutes and standard deviation of 5 minutes. Determine the percent of pizzas that were prepared and delivered.Between 20 and 25 minutes.
Assume that police response time to emergency calls is normally distributed with a mean of 9 minutes and a standard deviation of 2 minutes. Determine the percent of emergency calls with a police response time.More than 7.8 minutes.
Assume that police response time to emergency calls is normally distributed with a mean of 9 minutes and a standard deviation of 2 minutes. Determine the percent of emergency calls with a police response time.More than 12.2 minutes.
Assume that police response time to emergency calls is normally distributed with a mean of 9 minutes and a standard deviation of 2 minutes. Determine the percent of emergency calls with a police response time.Less than 12.2 minutes.
Assume that police response time to emergency calls is normally distributed with a mean of 9 minutes and a standard deviation of 2 minutes. Determine the percent of emergency calls with a police response time.Between 5 and 13 minutes.
Assume that police response time to emergency calls is normally distributed with a mean of 9 minutes and a standard deviation of 2 minutes. Determine the percent of emergency calls with a police response time.Between 7 and 11 minutes.
For the set of data 9, 10, 17, 19, 24, 12, 17, 28, 12, 22, 20, 26, determine the.Standard deviation.
For the set of data 9, 10, 17, 19, 24, 12, 17, 28, 12, 22, 20, 26, determine the.Range.
For the set of data 9, 10, 17, 19, 24, 12, 17, 28, 12, 22, 20, 26, determine the.Midrange.
For the set of data 9, 10, 17, 19, 24, 12, 17, 28, 12, 22, 20, 26, determine the.Mode.
For the set of data 9, 10, 17, 19, 24, 12, 17, 28, 12, 22, 20, 26, determine the.Median.
For the set of data 9, 10, 17, 19, 24, 12, 17, 28, 12, 22, 20, 26, determine the.Mean.
Use the following test scores: 69, 76, 81, 85, 86, 95. Determine the.Standard Deviation.
Use the following test scores: 69, 76, 81, 85, 86, 95. Determine the.Range.
Use the following test scores: 69, 76, 81, 85, 86, 95. Determine the.Midrange.
Use the following test scores: 69, 76, 81, 85, 86, 95. Determine the.Mode.
Use the following test scores: 69, 76, 81, 85, 86, 95. Determine the.Median.
Use the following test scores: 69, 76, 81, 85, 86, 95. Determine the.Mean.
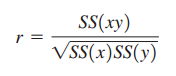
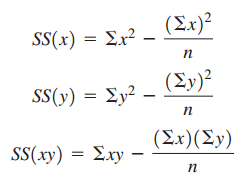
(a) There are equivalent formulas that can be used to find the correlation coefficient and the equation of the line of best fit. A formula used in some statistics books to find the correlation coefficient is.WhereUse this formula to find the correlation coefficient of the set of bivariate data
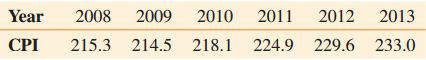
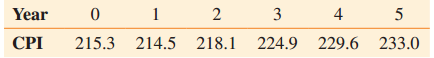
Use the following table. CPI represents consumer price index.(a) Calculate r. (b) If 2008 is subtracted from each year, the table obtained becomes:If r is calculated from these values, how will it compare with the r determined in part (a)?Explain. (c) Calculate r from the values in part
Assume that a set of bivariate data yields a specific correlation coefficient. If the x- and y-values are interchanged and the correlation coefficient is recalculated, will the correlation coefficient change? Correlation will not change.
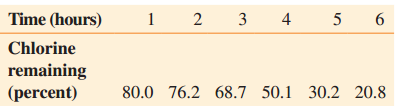
A gallon of chlorine is put into a swimming pool. Each hour later for the following 6 hours the percent of chlorine that remains in the pool is measured. The following information is obtained.(a) Determine the correlation coefficient for the time and the percent of chlorine remaining.(b) Determine
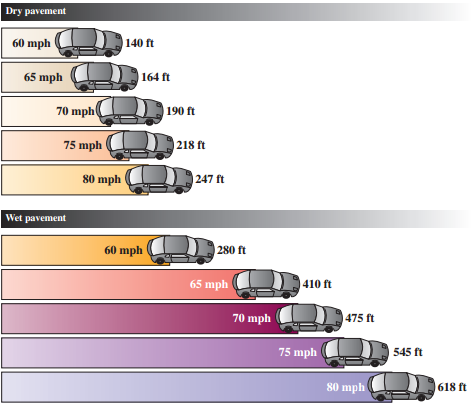
(a) Use the figure to construct two scatter diagrams, one for dry pavement and the other for wet pavement. Place the speed of the car on the horizontal axis. (b) Compute the correlation coefficient for the speed of the car and the stopping distance for dry pavement. (c) Were your
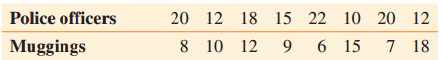
In a certain section of a city, muggings have been a problem. The number of police officers patrolling that section of the city has varied. The following chart shows the number of police officers patrolling and the number of muggings for 8 successive days.(a) Determine the correlation coefficient
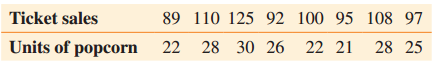
The ticket sales and the number of units of popcorn sold at AMC Cinema for 8 days is shown below.(a) Determine the correlation coefficient between ticket sales and units of popcorn sold. (b) Determine whether a correlation exists at a=0.05. (c) Determine the equation of the line of best
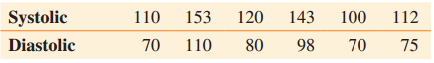
The following table shows the systolic blood pressure and diastolic blood pressure readings for six adults.(a) Determine the correlation coefficient between the systolic blood pressure and the diastolic blood pressure readings.(b) Determine whether a correlation exists at a=0.05. (c) Determine
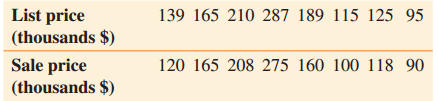
The following table shows the listing price and the selling price, in thousands of dollars, for eight houses listed and sold.(a) Determine the correlation coefficient between the listing price and the selling price of a house. (b) Determine whether a correlation exists at a=0.01. (c)
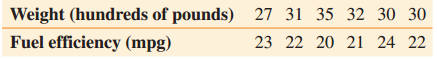
The following table shows the weights, in hundreds of pounds, for six selected cars. Also shown is the corresponding fuel efficiency, in miles per gallon (mpg), for the car in city driving.(a) Determine the correlation coefficient between the weight of a car and the fuel efficiency.(b) Determine
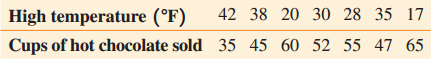
The high temperature for seven January days in Chicago along with the number of cups of hot chocolate sold for those days at the C and C Coffee Shop are shown in the table below.(a) Determine the correlation coefficient between the high temperature and the number of cups of hot chocolate
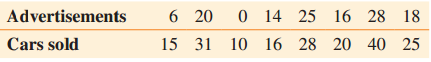
The following table shows the number of weekly television advertisements and the number of cars sold for an 8-week period at a car dealership.(a) Determine the correlation coefficient between the number of weekly television advertisements and the number of cars sold. (b) Determine whether a
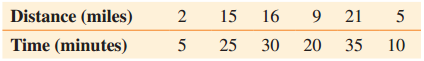
The following data show the commuting distances and commuting times of six college students to their college campus.(a) Determine the correlation coefficient between the com-muting distance and the commuting time.(b) Determine whether a correlation exists at α = 0.05.(c) Determine the equation of
Determine the equation of the line of best fit from the data indicated in the exercise. Round both m and b to the nearest hundredth.Exercise 26.Data from exercise 26:x . . . . . . . . . y90 . . . . . . . . 9070 . . . . . . . . 7065 . . . . . . . . 6560 . . . . . . . . 6050 . . . . . . . . 5040 . .
If the mean score on a math quiz is 12.0 and 77% of the students in your class scored between 9.6 and 14.4, determine the standard deviation of the quiz scores.
Determine a value of z such that z ≤ 0 and 11.9% of the standard normal curve lies to the left of the z-value.
Determine a value of z such that z ≥ 0 and 97.5% of the standard normal curve lies to the left of the z-value.
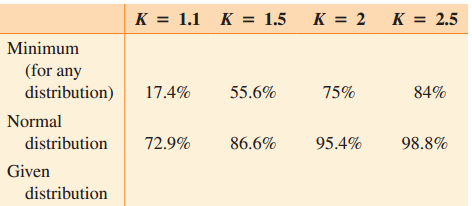
The following table lists the minimum percent of data in any distribution and the actual percent of data in the normal distribution between ± 1.1, ± 1.5, ± 2.0, and ± 2.5 standard deviations from the mean. The minimum percents of data in any distribution were calculated by using Chebyshev’s
The owner at Kim’s Home Interiors is reviewing the sales records of two managers who are up for promotion, Katie and Stella, who work in different stores. At Katie’s store, the mean sales have been $23,200 per month, with a standard deviation of $2170. At Stella’s store, the mean sales have
In a distribution skewed to the left, which has the greatest value: the mean, median, or mode? Which has the smallest value? Explain.
In a distribution that is skewed to the right, which has the greatest value: the mean, median, or mode? Which has the smallest value? Explain.
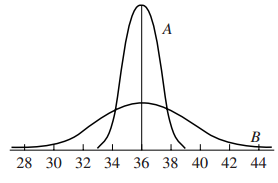
Consider the following two normal curves.(a) Do these distributions have the same mean? If so, what is the mean? (b) One of these curves corresponds to a normal distribution with a standard deviation of 1. The other curve corresponds to a normal distribution with a standard deviation of 3.
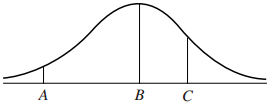
Consider the following normal curve, representing a normal distribution, with points A, B, and C. One of these points corresponds to the mean, one point corresponds to the mean plus one standard deviation, and one point corresponds to the mean minus two standard deviations.(a) Which point
Mr. Sanderson marks his class on a normal curve. Those with z-scores with z ≥ 1.80 will receive an A, those with 1.10 ≤ z < 1.80 will receive a B, those with -1.20 ≤ z < 1.10 will receive a C, those with -1.90 ≤ z < -1.20 will receive a D, those with z < -1.90 will receive an F.
A vending machine that dispenses coffee does not appear to be working correctly. The machine rarely gives the proper amount of coffee. Some of the time the cup is underfilled, and some of the time the cup over-flows. Does this variation indicate that the mean number of ounces dispensed has to be
The warranty on a car battery is 36 months. If the breakdown times of this battery are normally distributed with a mean of 46 months and a standard deviation of 8 months, determine the percent of batteries that can be expected to require repair or replacement under warranty.
A weight-loss clinic guarantees that its new customers will lose at least 5 lb by the end of their first month of participation or their money will be refunded. If the weight loss of customers at the end of their first month is normally distributed, with a mean of 6.7 lb and a standard deviation of
In a random sample of 120 families that use day care, how many pay between $6500 and $8750 annually for day care per child?Assume the annual day care cost per child is normally distributed with a mean of $8000 and a standard deviation of $1500.
In a random sample of 120 families that use day care, how many pay more than $7250 annually for day care per child?Assume the annual day care cost per child is normally distributed with a mean of $8000 and a standard deviation of $1500.
What percent of day care costs are less than $11,750 annually?Assume the annual day care cost per child is normally distributed with a mean of $8000 and a standard deviation of $1500.
What percent of day care costs are more than $11,750 annually?Assume the annual day care cost per child is normally distributed with a mean of $8000 and a standard deviation of $1500.
What percent of day care costs are between $6500 and $8750 annually?Assume the annual day care cost per child is normally distributed with a mean of $8000 and a standard deviation of $1500.
What percent of day care costs are more than $7100 annually?Assume the annual day care cost per child is normally distributed with a mean of $8000 and a standard deviation of $1500.
If the farm produces 500 watermelons, how many will weigh more than 24.48 pounds?Assume that the weight of ripe watermelons grown at Wambach’s farm are normally distributed with a mean of 20 pounds and a standard deviation of 2.8 pounds.
If the farm produces 500 watermelons, how many will weigh less than 15.24 pounds?Assume that the weight of ripe watermelons grown at Wambach’s farm are normally distributed with a mean of 20 pounds and a standard deviation of 2.8 pounds.
Determine the percent of watermelons that weigh more than 24.48 pounds.Assume that the weight of ripe watermelons grown at Wambach’s farm are normally distributed with a mean of 20 pounds and a standard deviation of 2.8 pounds.
Determine the percent of watermelons that weigh between 15.24 pounds and 28.12 pounds.Assume that the weight of ripe watermelons grown at Wambach’s farm are normally distributed with a mean of 20 pounds and a standard deviation of 2.8 pounds.
If 200 cars are selected at random, how many will be traveling faster than 70 mph?Assume that the speed of automobiles on an expressway during rush hour is normally distributed with a mean of 62 mph and a standard deviation of 5 mph.
If 200 cars are selected at random, how many will be traveling slower than 56 mph?Assume that the speed of automobiles on an expressway during rush hour is normally distributed with a mean of 62 mph and a standard deviation of 5 mph.
What percent of cars are traveling faster than 70 mph?Assume that the speed of automobiles on an expressway during rush hour is normally distributed with a mean of 62 mph and a standard deviation of 5 mph.
What percent of cars are traveling slower than 56 mph?Assume that the speed of automobiles on an expressway during rush hour is normally distributed with a mean of 62 mph and a standard deviation of 5 mph.
What percent of cars are traveling between 58 mph and 66 mph?Assume that the speed of automobiles on an expressway during rush hour is normally distributed with a mean of 62 mph and a standard deviation of 5 mph.
What percent of cars are traveling faster than 62 mph?Assume that the speed of automobiles on an expressway during rush hour is normally distributed with a mean of 62 mph and a standard deviation of 5 mph.
A vending machine is designed to dispense a mean of 7.6 oz of coffee into an 8-oz cup. If the standard deviation of the amount of coffee dispensed is 0.4 oz and the amount is normally distributed, find the percent of times the machine will.Result in the cup overflowing (therefore dispense more than
A vending machine is designed to dispense a mean of 7.6 oz of coffee into an 8-oz cup. If the standard deviation of the amount of coffee dispensed is 0.4 oz and the amount is normally distributed, find the percent of times the machine will.Dispense less than 7.7 oz.
A vending machine is designed to dispense a mean of 7.6 oz of coffee into an 8-oz cup. If the standard deviation of the amount of coffee dispensed is 0.4 oz and the amount is normally distributed, find the percent of times the machine will.Dispense less than 7.0 oz.
A vending machine is designed to dispense a mean of 7.6 oz of coffee into an 8-oz cup. If the standard deviation of the amount of coffee dispensed is 0.4 oz and the amount is normally distributed, find the percent of times the machine will.Dispense from 7.4 oz to 7.7 oz.
What percent of students who took the test have a mathematics score above 480?Assume that the mathematics scores on the SAT are normally distributed with a mean of 500 and a standard deviation of 100.
What percent of students who took the test have a mathematics score between 400 and 575?Assume that the mathematics scores on the SAT are normally distributed with a mean of 500 and a standard deviation of 100.
What percent of students who took the test have a mathematics score below 300?Assume that the mathematics scores on the SAT are normally distributed with a mean of 500 and a standard deviation of 100.
What percent of students who took the test have a mathematics score between 550 and 650?Assume that the mathematics scores on the SAT are normally distributed with a mean of 500 and a standard deviation of 100.
What percent of students who took the test have a mathematics score above 680?Assume that the mathematics scores on the SAT are normally distributed with a mean of 500 and a standard deviation of 100.
What percent of students who took the test have a mathematics score below 550?Assume that the mathematics scores on the SAT are normally distributed with a mean of 500 and a standard deviation of 100.
In a random sample of 500 callers, how many are on hold for at least 4 minutes?Assume the hold time of callers to General Cable is normally distributed with a mean of 3.0 minutes and a standard deviation of 0.8 minute.
Determine the percent of callers who are on hold at least 4 minutes?Assume the hold time of callers to General Cable is normally distributed with a mean of 3.0 minutes and a standard deviation of 0.8 minute.
Determine the percent of callers who are on hold between 2.2 minutes and 4.6 minutes.Assume the hold time of callers to General Cable is normally distributed with a mean of 3.0 minutes and a standard deviation of 0.8 minute.
Determine the percent of callers who are on hold for more than 3.0 minutes.Assume the hold time of callers to General Cable is normally distributed with a mean of 3.0 minutes and a standard deviation of 0.8 minute.
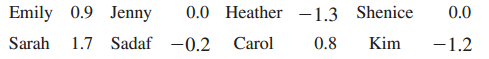
Assume that the heights of 7-year-old girls are normally distributed. The heights of 8 girls are given in z-scores below.(a) Which girl is the tallest? (b) Which girl is the shortest? Emily 0.9 Jenny 1.7 Sadaf 0.0 Heather -1.3 Shenice 0.0 Kim Sarah -0.2 Carol 0.8 -1.2
Assume that the heights of 7-year-old girls are normally distributed. The heights of 8 girls are given in z-scores below.(a) Which of these girls are taller than the mean?(b) Which of these girls are at the mean? (c) Which of these girls are shorter than the mean? Emily 0.9 Jenny 1.7 Sadaf 0.0
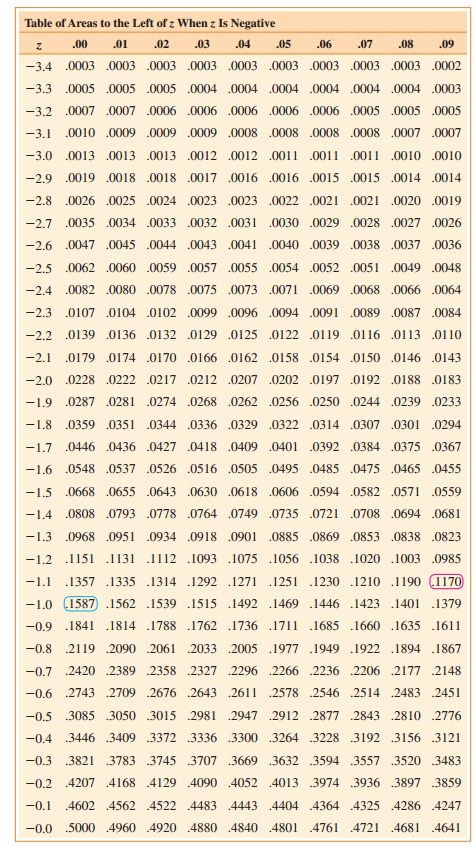
Use Table 12.8 to determine the percent of data specified.Table 12.8:Between z = -2.71 and z = 3.21 Table of Areas to the Left of z When z Is Negative „00 .02 .04 .05 .01 .03 .06 .07 .08 .09 -3.4 .0003 .0003 .0003 .0003 .0003 .0003 .0003 .0003 .0003 .0002 -3.3 .0005 .0005 .0005 .0004 .0004 .0004
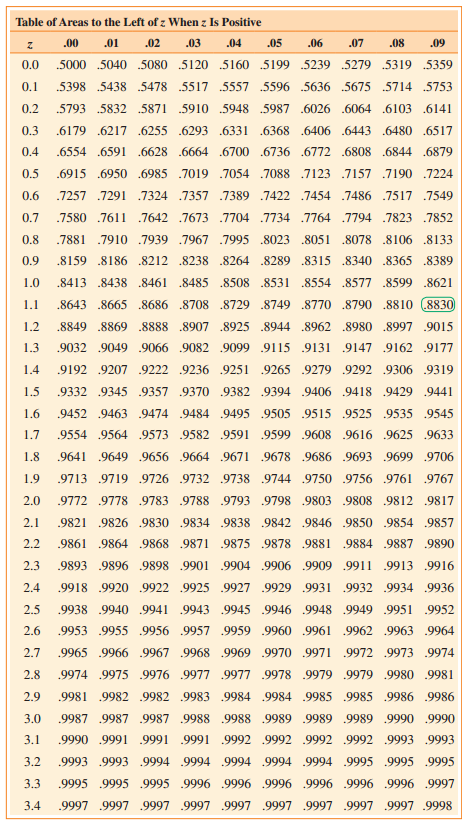
Use Table 12.8 to determine the percent of data specified.Table 12.8:Between z = 0.72 and z = 2.14 Table of Areas to the Left of z When z Is Negative „00 .02 .04 .05 .01 .03 .06 .07 .08 .09 -3.4 .0003 .0003 .0003 .0003 .0003 .0003 .0003 .0003 .0003 .0002 -3.3 .0005 .0005 .0005 .0004 .0004 .0004
Use Table 12.8 to determine the percent of data specified.Table 12.8:Between z = -1.53 and z = -1.82 Table of Areas to the Left of z When z Is Negative „00 .02 .04 .05 .01 .03 .06 .07 .08 .09 -3.4 .0003 .0003 .0003 .0003 .0003 .0003 .0003 .0003 .0003 .0002 -3.3 .0005 .0005 .0005 .0004 .0004 .0004
Use Table 12.8 to determine the percent of data specified.Table 12.8:Between z = 1.96 and z = 2.14 Table of Areas to the Left of z When z Is Negative „00 .02 .04 .05 .01 .03 .06 .07 .08 .09 -3.4 .0003 .0003 .0003 .0003 .0003 .0003 .0003 .0003 .0003 .0002 -3.3 .0005 .0005 .0005 .0004 .0004 .0004
Use Table 12.8 to determine the percent of data specified.Table 12.8:Between z = -2.18 and z = -1.90 Table of Areas to the Left of z When z Is Negative „00 .02 .04 .05 .01 .03 .06 .07 .08 .09 -3.4 .0003 .0003 .0003 .0003 .0003 .0003 .0003 .0003 .0003 .0002 -3.3 .0005 .0005 .0005 .0004 .0004 .0004
Use Table 12.8 to determine the percent of data specified.Table 12.8:Between z = -1.34 and z = 2.24 Table of Areas to the Left of z When z Is Negative „00 .02 .04 .05 .01 .03 .06 .07 .08 .09 -3.4 .0003 .0003 .0003 .0003 .0003 .0003 .0003 .0003 .0003 .0002 -3.3 .0005 .0005 .0005 .0004 .0004 .0004
Use Table 12.8 to determine the percent of data specified.Table 12.8:Greater than z = 2.66 Table of Areas to the Left of z When z Is Negative „00 .02 .04 .05 .01 .03 .06 .07 .08 .09 -3.4 .0003 .0003 .0003 .0003 .0003 .0003 .0003 .0003 .0003 .0002 -3.3 .0005 .0005 .0005 .0004 .0004 .0004 .0004
Use Table 12.8 to determine the percent of data specified.Table 12.8:Greater than z = -1.90 Table of Areas to the Left of z When z Is Negative „00 .02 .04 .05 .01 .03 .06 .07 .08 .09 -3.4 .0003 .0003 .0003 .0003 .0003 .0003 .0003 .0003 .0003 .0002 -3.3 .0005 .0005 .0005 .0004 .0004 .0004 .0004
Use Table 12.8 to determine the percent of data specified.Table 12.8:Less than z = -0.91 Table of Areas to the Left of z When z Is Negative „00 .02 .04 .05 .01 .03 .06 .07 .08 .09 -3.4 .0003 .0003 .0003 .0003 .0003 .0003 .0003 .0003 .0003 .0002 -3.3 .0005 .0005 .0005 .0004 .0004 .0004 .0004 .0004
Use Table 12.8 to determine the percent of data specified.Table 12.8:Less than z = 0.79 Table of Areas to the Left of z When z Is Negative „00 .02 .04 .05 .01 .03 .06 .07 .08 .09 -3.4 .0003 .0003 .0003 .0003 .0003 .0003 .0003 .0003 .0003 .0002 -3.3 .0005 .0005 .0005 .0004 .0004 .0004 .0004 .0004
Use Table 12.8 to find the specified area.Table 12.8:Between z = 1.23 and z = 1.81 Table of Areas to the Left of z When z Is Negative „00 .02 .04 .05 .01 .03 .06 .07 .08 .09 -3.4 .0003 .0003 .0003 .0003 .0003 .0003 .0003 .0003 .0003 .0002 -3.3 .0005 .0005 .0005 .0004 .0004 .0004 .0004 .0004 .0004
Use Table 12.8 to find the specified area.Table 12.8:Between z = -1.32 and z = -1.64 Table of Areas to the Left of z When z Is Negative „00 .02 .04 .05 .01 .03 .06 .07 .08 .09 -3.4 .0003 .0003 .0003 .0003 .0003 .0003 .0003 .0003 .0003 .0002 -3.3 .0005 .0005 .0005 .0004 .0004 .0004 .0004 .0004
Use Table 12.8 to find the specified area.Table 12.8:To the left of z = -0.92 Table of Areas to the Left of z When z Is Negative „00 .02 .04 .05 .01 .03 .06 .07 .08 .09 -3.4 .0003 .0003 .0003 .0003 .0003 .0003 .0003 .0003 .0003 .0002 -3.3 .0005 .0005 .0005 .0004 .0004 .0004 .0004 .0004 .0004
Use Table 12.8 to find the specified area.Table 12.8:To the left of z = -2.13 Table of Areas to the Left of z When z Is Negative „00 .02 .04 .05 .01 .03 .06 .07 .08 .09 -3.4 .0003 .0003 .0003 .0003 .0003 .0003 .0003 .0003 .0003 .0002 -3.3 .0005 .0005 .0005 .0004 .0004 .0004 .0004 .0004 .0004
Use Table 12.8 to find the specified area.Table 12.8:To the right of z = -1.78 Table of Areas to the Left of z When z Is Negative „00 .02 .04 .05 .01 .03 .06 .07 .08 .09 -3.4 .0003 .0003 .0003 .0003 .0003 .0003 .0003 .0003 .0003 .0002 -3.3 .0005 .0005 .0005 .0004 .0004 .0004 .0004 .0004 .0004
Use Table 12.8 to find the specified area.Table 12.8:To the left of z = -1.78 Table of Areas to the Left of z When z Is Negative „00 .02 .04 .05 .01 .03 .06 .07 .08 .09 -3.4 .0003 .0003 .0003 .0003 .0003 .0003 .0003 .0003 .0003 .0002 -3.3 .0005 .0005 .0005 .0004 .0004 .0004 .0004 .0004 .0004
Use Table 12.8 to find the specified area.Table 12.8:To the left of z = 1.43 Table of Areas to the Left of z When z Is Negative „00 .02 .04 .05 .01 .03 .06 .07 .08 .09 -3.4 .0003 .0003 .0003 .0003 .0003 .0003 .0003 .0003 .0003 .0002 -3.3 .0005 .0005 .0005 .0004 .0004 .0004 .0004 .0004 .0004 .0003
Use Table 12.8 to find the specified area.Table 12.8:To the right of z = 1.26 Table of Areas to the Left of z When z Is Negative „00 .02 .04 .05 .01 .03 .06 .07 .08 .09 -3.4 .0003 .0003 .0003 .0003 .0003 .0003 .0003 .0003 .0003 .0002 -3.3 .0005 .0005 .0005 .0004 .0004 .0004 .0004 .0004 .0004
Use Table 12.8 to find the specified area.Table 12.8:Between 1.30 and 1.70 standard deviations above the mean. Table of Areas to the Left of z When z Is Negative „00 .02 .04 .05 .01 .03 .06 .07 .08 .09 -3.4 .0003 .0003 .0003 .0003 .0003 .0003 .0003 .0003 .0003 .0002 -3.3 .0005 .0005 .0005 .0004
Showing 800 - 900
of 6427
First
2
3
4
5
6
7
8
9
10
11
12
13
14
15
16
Last
Step by Step Answers