

Question: The scatterplot below shows a students grade on a test against the numbers of hours that student spend studying each night. Based on the correlation
The scatterplot below shows a student’s grade on a test against the numbers of hours that student spend studying each night.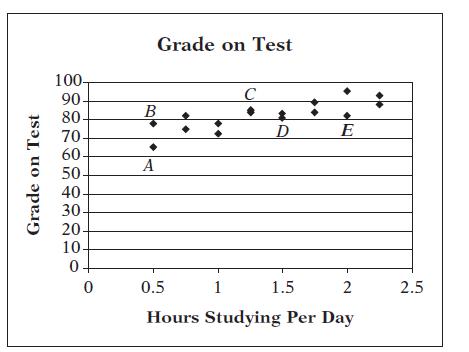
Based on the correlation of the data, which would most likely be the test grade of a student who studies 3 hours a day?
A. 50
B. 60
C. 70
D. 80
E. 90
Grade on Test 100- 90- 80- 70- 60- 50- 40. 30- 20- 10- 0- 0 Grade on Test B A C 0.5 D E 1 1.5 2 Hours Studying Per Day 2.5
Step by Step Solution
★★★★★
3.30 Rating (159 Votes )
There are 3 Steps involved in it
1 Expert Approved Answer
Step: 1 Unlock

E This scatterplot indicates a positive correlation betwe... View full answer
Question Has Been Solved by an Expert!
Get step-by-step solutions from verified subject matter experts
Step: 2 Unlock
Step: 3 Unlock