

Question: Data A.1 on page 136 introduces a study that examines the effect of light at night on weight gain in a sample of 27 mice
Data A.1 on page 136 introduces a study that examines the effect of light at night on weight gain in a sample of 27 mice observed over a fourweek period. The mice who had a light on at night gained significantly more weight than the mice with darkness at night, despite eating the same number of calories and exercising the same amount. Researchers noticed that the mice with light at night ate a greater percentage of their calories during the day (when mice are supposed to be sleeping). The computer output shown below allows us to examine the relationship between percent of calories eaten during the day, DayPct, and body mass gain in grams, BM Gain. A scatterplot with regression line is shown in Figure 9.8.
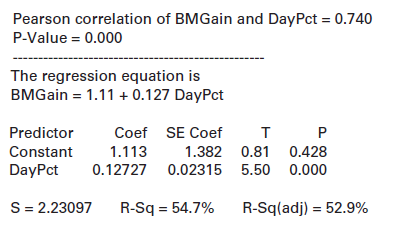
Figure 9.8
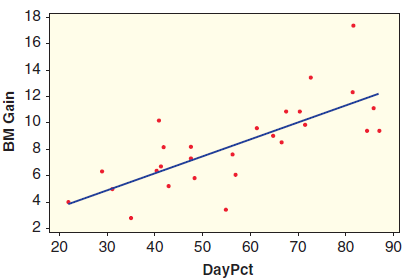
(a) Use the scatterplot to determine whether we should have any strong concerns about the conditions being met for using a linear model with these data.
(b) What is the correlation between these two variables? What is the p-value from a test of the correlation? What is the conclusion of the test, in context?
(c) What is the least squares line to predict body mass gain from percent daytime consumption? What gain is predicted for a mouse that eats 50% of its calories during the day (DayPct = 50)?
(d) What is the estimated slope for this regression model? Interpret the slope in context.
(e) What is the p-value for a test of the slope? What is the conclusion of the test, in context?
(f) What is the relationship between the p-value of the correlation test and the p-value of the slope test?
(g) What is R2 for this linear model? Interpret it in context.
(h) Verify that the correlation squared gives the coefficient of determination R2.
Data A.1 on page 136
Numerous studies have shown that exposure to light at night is harmful to human health. A recent study in mice shows that even low-level light at night can interfere with normal eating and sleeping cycles. Furthermore, the study finds that food is especially fattening if consumed at the wrong time of day, at least in mice. In the study, 27 mice were randomly split into three groups. One group was on a normal light€“dark cycle (LD), one group had bright light on all the time (LL), and one group had light during the day and dim light at night (DM). The dim light was equivalent to having a television set on in a room. The mice in darkness ate most of their food during their active (nighttime) period, matching the behavior of mice in the wild. The mice in both dim light and bright light, however, consumed more than half of their food during the well-lit rest period, when most mice are sleeping. Although the data collected show that the three groups of mice ate approximately the same amount of food and had the same levels of physical activity, the mice exposed to light at night gained substantially more weight, ate a greater percent of calories during the day, and were more likely to be classified as glucose intolerant at the end of the study. An absence of darkness seems to be associated with fatter mice.
Pearson correlation of BMGain and DayPct = 0.740 P-Value = 0.000 The regression equation is BMGain = 1.11 + 0.127 DayPct Predictor Coef SE Coef Constant 1.113 1.382 0.81 0.428 DayPct 0.12727 0.02315 5.50 0.000 S= 2.23097 R-Sq = 54.7% R-Sq(adj) = 52.9% 18 16 . 14 12 - 10 6- 30 40 50 60 70 80 90 DayPct BM Gain 2.
Step by Step Solution
3.45 Rating (161 Votes )
There are 3 Steps involved in it
a On the scatterplot we have concerns if there is a curved pattern there isnt or variability from th... View full answer

Get step-by-step solutions from verified subject matter experts