

Use a demand and supply graph to illustrate the effects of the increase in the demand for
Question:
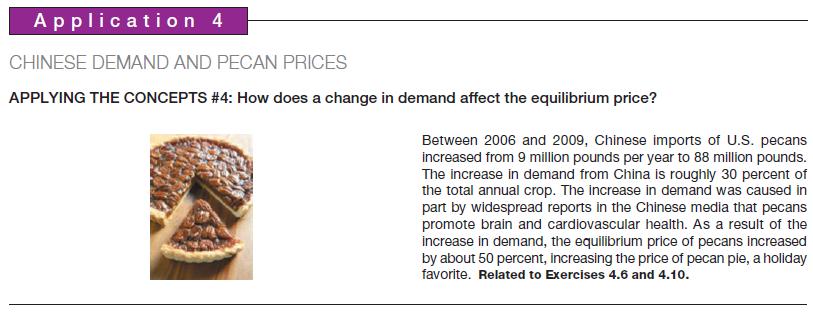
Use a demand and supply graph to illustrate the effects of the increase in the demand for pecans from Chinese consumers. Assume that the initial equilibrium price is $6 per unit. (Related to Application 4)
Fantastic news! We've Found the answer you've been seeking!
Step by Step Answer:
Answer below is graph illustrating the effects of the increase in ...View the full answer

Answered By
Lisper Wanja
I am an experienced and highly motivated writer with a passion for the skills listed. I have a proven track record of my expertise and my aim is to deliver quality, well-detailed and plagiarism free projects. My genuine passion for writing combined with my ongoing professional development through school and research makes me an ideal candidate within for any assignment.
233+ Reviews
388+ Question Solved
Related Book For 

Microeconomics Principles Applications And Tools
ISBN: 9780134078878
9th Edition
Authors: Arthur O'Sullivan, Steven Sheffrin, Stephen Perez
Question Posted:
