

The market shown in Figure 6P-6 is in equilibrium. Suppose there is a $1.50 per unit tax
Question:
Figure 6P-6:
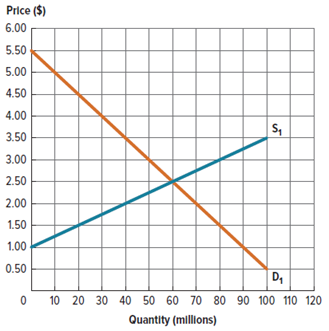
a. Draw the after-tax supply curve.
b. Plot the after-tax price paid by consumers and the after-tax price paid by sellers.
c. Draw consumer surplus, producer surplus, tax revenue, and deadweight loss after the tax.
d. Calculate deadweight loss.
e. Calculate total surplus.
Fantastic news! We've Found the answer you've been seeking!
Step by Step Answer:
a Each unit of the good is now 150 more costly to produce and sell Thu...View the full answer

Answered By
Utsab mitra
I have the expertise to deliver these subjects to college and higher-level students. The services would involve only solving assignments, homework help, and others.
I have experience in delivering these subjects for the last 6 years on a freelancing basis in different companies around the globe. I am CMA certified and CGMA UK. I have professional experience of 18 years in the industry involved in the manufacturing company and IT implementation experience of over 12 years.
I have delivered this help to students effortlessly, which is essential to give the students a good grade in their studies.
2+ Reviews
10+ Question Solved
Related Book For 
Question Posted:
