

In Figure 4 draw in the demand curve and the marginal revenue curve of a monopolist making
Question:
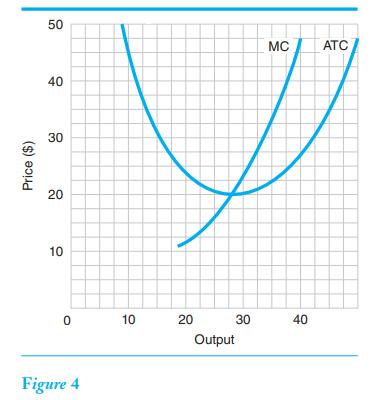
In Figure 4 draw in the demand curve and the marginal revenue curve of a monopolist making a profit. How much is the most profitable output?
Step by Step Answer:

This question has not been answered yet.
You can Ask your question!
Related Book For 

Question Posted:
