

Question: Determine the correlations (based on the 19732012 data) among annual returns on stocks, T-bills, and bonds. Then determine the correlations (based on the 1,000 scenarios
Determine the correlations (based on the 1973–2012 data) among annual returns on stocks, T-bills, and bonds. Then determine the correlations (based on the 1,000 scenarios created by bootstrapping) among the final values for stocks, T-bills, and bonds. Does it appear that the bootstrapping approach picks up the interdependence among the returns on stocks, T-bills, and bonds?
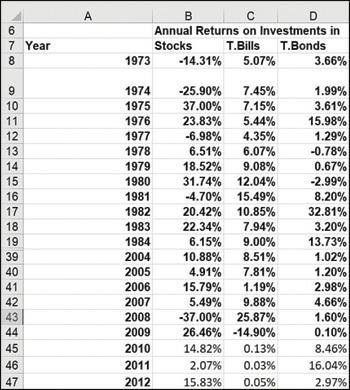
6 7 Year 8 9 10 11 12 13 14 15 16 17 18 19 39 40 41 42 43 44 45 46 47 A 1973 B C Annual Returns on Investments in Stocks T.Bills T.Bonds 5.07% 3.66% -14.31% -25.90% 7.45% 37.00% 7.15% 23.83% 5.44% -6.98% 4.35% 6.51% 6.07% 18.52% 9.08% 1974 1975 1976 1977 1978 1979 1980 31.74% 12.04% 1981 -4.70% 15.49% 1982 20.42% 10.85% 1983 22.34% 7.94% 1984 6.15% 9.00% 2004 10.88% 8.51% 2005 4.91% 7.81% 2006 15.79% 1.19% 2007 5.49% 9.88% 2008 -37.00% 25.87% 2009 26.46% -14.90% 2010 14.82% 0.13% 2011 2.07% 0.03% 2012 15.83% 0.05% 1.99% 3.61% 15.98% 1.29% -0.78% 0.67% -2.99% 8.20% 32.81% 3.20% 13.73% 1.02% 1.20% 2.98% 4.66% 1.60% 0.10% 8.46% 16.04% 2.97%
Step by Step Solution
3.31 Rating (154 Votes )
There are 3 Steps involved in it
Based on the given data 19732012 the correlation coefficients among the annual returns on stocks Tbi... View full answer

Get step-by-step solutions from verified subject matter experts