

Question: Using the data in the file named Monthtomonth.xlsx, create a PivotTable that shows for the year 2010 how each months sales differ from the previous
Using the data in the file named Monthtomonth.xlsx, create a PivotTable that shows for the year 2010 how each month’s sales differ from the previous month.
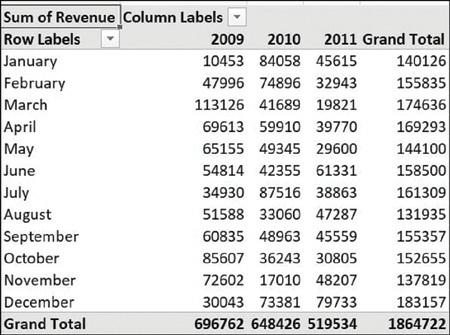
Sum of Revenue Column Labels Row Labels January February March April May June July August September October November December Grand Total 2009 2010 2011 Grand Total 10453 84058 45615 140126 47996 74896 32943 155835 113126 41689 19821 174636 69613 59910 39770 169293 65155 49345 29600 144100 54814 42355 61331 158500 34930 87516 38863 161309 51588 33060 47287 131935 60835 48963 45559 155357 85607 36243 30805 152655 72602 17010 48207 137819 30043 73381 79733 183157 696762 648426 519534 1864722
Step by Step Solution
3.46 Rating (175 Votes )
There are 3 Steps involved in it
To create a PivotTable in Excel that shows for the year 2010 how each months sales differ from the previous month you can follow these steps below Unf... View full answer

Get step-by-step solutions from verified subject matter experts