

Question: Construct a cumulative frequency table and a cumulative frequency curve for the grouped data, established in Practice Question 9.2, representing the percentage marks data given
Construct a cumulative frequency table and a cumulative frequency curve for the grouped data, established in Practice Question 9.2, representing the percentage marks data given in Table 9.8.
Data from Practice Question 9.2
The data given in Table 9.8 represents the percentage marks scored by 66 candidates in an examination.
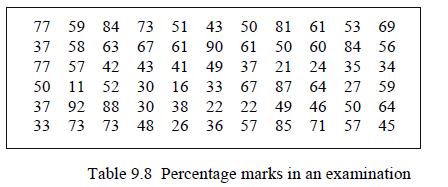
77 59 84 73 73 37 58 63 67 61 51 43 50 81 61 53 69 90 61 50 60 84 56 57 42 43 41 49 37 21 16 33 67 21 24 35 34 30 87 64 27 59 77 50 11 52 30 37 92 88 30 30 73 73 48 38 22 22 49 49 46 46 50 64 26 36 57 85 71 71 57 45 33 Table 9.8 Percentage marks in an examination
Step by Step Solution
3.30 Rating (162 Votes )
There are 3 Steps involved in it
Marks 1019 2029 3039 4049 5059 6069 7079 80... View full answer

Get step-by-step solutions from verified subject matter experts