

Question: Construct a ranked stem-and-leaf plot for the grouped data, established in Practice Question 9.2, representing the percentage marks data given in Table 9.8. Data from
Construct a ranked stem-and-leaf plot for the grouped data, established in Practice Question 9.2, representing the percentage marks data given in Table 9.8.
Data from Practice Question 9.2
The data given in Table 9.8 represents the percentage marks scored by 66 candidates in an examination.
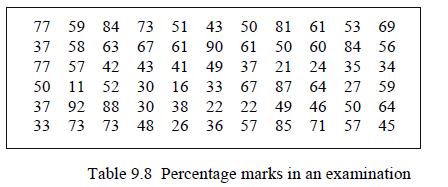
77 59 84 73 73 37 58 63 67 61 51 43 50 81 61 53 69 90 61 50 60 84 56 57 42 43 41 49 37 21 16 33 67 21 24 35 34 30 87 64 27 59 77 50 11 52 30 37 92 88 30 30 73 73 48 38 22 22 49 49 46 46 50 64 26 36 57 85 71 71 57 45 33 Table 9.8 Percentage marks in an examination
Step by Step Solution
3.49 Rating (139 Votes )
There are 3 Steps involved in it
STEM 1 2 3 4 5 6 7 9 LEAF 16 1 2 ... View full answer

Get step-by-step solutions from verified subject matter experts