

Question: The data given in Table 9.8 represents the percentage marks scored by 66 candidates in an examination. (a) What is the lowest mark? (b) What
The data given in Table 9.8 represents the percentage marks scored by 66 candidates in an examination.
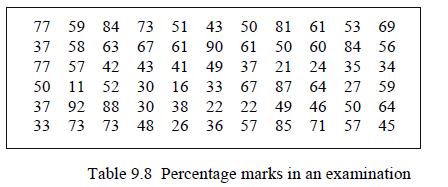
(a) What is the lowest mark?
(b) What is the highest mark?
(c) What is the range of the data set?
(d) Select convenient class intervals by dividing the range into 9 equal sub classes.
(e) Summarise the data in a grouped tally/frequency table.
(f) Represent the data by means of a bar chart.
(g) Draw a frequency polygon for the data.
77 59 84 73 73 37 58 63 67 61 51 43 50 81 61 53 69 90 61 50 60 84 56 57 42 43 41 49 37 21 16 33 67 21 24 35 34 30 87 64 27 59 77 50 11 52 30 37 92 88 30 30 73 73 48 38 22 22 49 49 46 46 50 64 26 36 57 85 71 71 57 45 33 Table 9.8 Percentage marks in an examination
Step by Step Solution
3.45 Rating (155 Votes )
There are 3 Steps involved in it
a 11 b 92 c 81 d e f g ... View full answer

Get step-by-step solutions from verified subject matter experts