

Question: A Compton scattering experiment yielded the data in the table below. (a) Using Equation 3-25 as a guide, construct an appropriate graph that enables you
A Compton scattering experiment yielded the data in the table below.
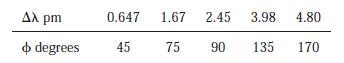
(a) Using Equation 3-25 as a guide, construct an appropriate graph that enables you to obtain a value for the Compton wavelength of the electron.
(b) By what percent (+ or -) does your result differ from the accepted value?

pm $ degrees 0.647 1.67 2.45 45 3.98 4.80 170 75 90 135
Step by Step Solution
★★★★★
3.47 Rating (180 Votes )
There are 3 Steps involved in it
1 Expert Approved Answer
Step: 1 Unlock

a First add a row 1cos to the table in the problem then plot a ... View full answer
Question Has Been Solved by an Expert!
Get step-by-step solutions from verified subject matter experts
Step: 2 Unlock
Step: 3 Unlock