

Question: Using the data in Figure 4-24b and a good ruler, draw a carefully scaled energy-level diagram covering the range from 0 eV to 60 eV
Using the data in Figure 4-24b and a good ruler, draw a carefully scaled energy-level diagram covering the range from 0 eV to 60 eV for the vibrational states of this solid. What approximate energy is typical of the transitions between adjacent levels corresponding to the larger of each pair of peaks?
Figure 4-24b
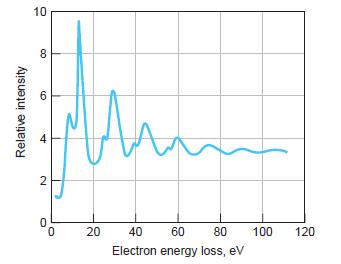
Relative intensity 10 8 6 4 2 0 0 20 40 60 80 Electron energy loss, ev 100 120
Step by Step Solution
★★★★★
3.45 Rating (161 Votes )
There are 3 Steps involved in it
1 Expert Approved Answer
Step: 1 Unlock

60 50 E eV 40 30 ... View full answer
Question Has Been Solved by an Expert!
Get step-by-step solutions from verified subject matter experts
Step: 2 Unlock
Step: 3 Unlock