

Discuss the graph found in Figure 14-5. What does it show? Does the difference in cost surprise
Question:
Discuss the graph found in Figure 14-5. What does it show? Does the difference in cost surprise you? How big is the largest difference between the dots shown on the diagram? What are its consequences for maintenance as well as the entire SDLC?
Figure 14-5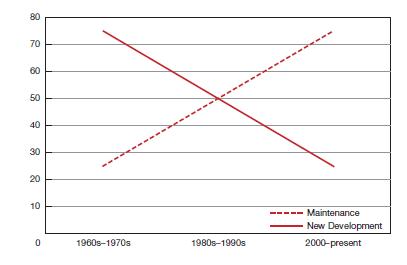
Fantastic news! We've Found the answer you've been seeking!
Step by Step Answer:
The graph in Figure 145 shows the cost of fixing a bug at different stages of the software developme...View the full answer

Answered By
Fahmin Arakkal
Tutoring and Contributing expert question and answers to teachers and students.
Primarily oversees the Heat and Mass Transfer contents presented on websites and blogs.
Responsible for Creating, Editing, Updating all contents related Chemical Engineering in
latex language
8+ Reviews
22+ Question Solved
Related Book For 

Modern Systems Analysis And Design
ISBN: 9781292351629
9th Global Edition
Authors: Joe Valacich, Joey George
Question Posted:
