

It was late. Sally Fukuyama, assistant director of marketing, knocked on the slightly open door of Jim
Question:
It was late. Sally Fukuyama, assistant director of marketing, knocked on the slightly open door of Jim Watanabe’s office. Jim was the project director for the “No Customer Escapes” customer loyalty system for Petrie Electronics. “Yeah, come in,” Jim called.
“Hi, Jim,” Sally said, pushing the door open further. “Are you getting ready to leave?”
“Well, I was thinking about it, but something tells me that I’m probably not leaving any time soon. What’s up?”
“I just got an e-mail from John [John Smith, the head of marketing at Petrie]. He has a whole bunch of reports he wants this system to generate,” Sally replied. She took the stuffed manila folder in her hand and dropped it on Jim’s desk.
“What is all this?” he moaned.
“John says all of these reports are absolutely essential. He says you should be able to generate all of the necessary data from the new customer loyalty system.”
“It will take forever to work out the specific designs on all of these reports,” Jim said. “I’m going to need a lot of help on this.” Jim dropped the folder on his desk. “Sorry, Jim,” Sally said. “I’ll help you tomorrow, but I really need to go.”
“OK, bye,” Jim said, as Sally left his office.
He opened the folder and started to look at what was there. Some of the report requirements were more complete than others. One of the reports near the top of the heap focused on listing the best customers, based on how much they had spent in a particular month. “I’ll start with this one,” Jim thought. “I think I’ll do a quick design in Excel.”
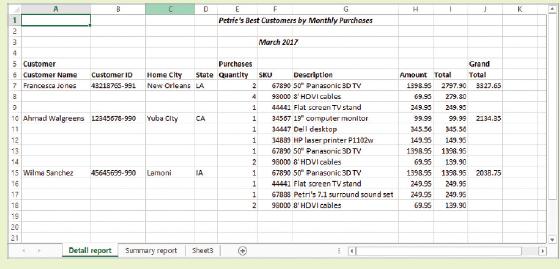
Jim worked on the report design for 15 minutes. His first cut is featured in PE Figures 10-1 and 10-2. PE Figure 10-1 shows the high-level summary report, which lists only the names of the customers, where they are from, and the total they spent during a given month. PE Figure 10-2 shows the details of what each customer bought.
“Well,” Jim thought, “these are certainly practical designs for the reports. They show what John says he wants, but they sure are ugly. I wonder how I can make them look better. No time for that now. I have to start work on all of these other report designs. How many are there? A hundred? Sure seems like it. Maybe I can get the interns to work on some of this. It would be good for them.”
Jim looked over the next suggestion for a report from John’s stack of requests.
Case Questions
1. How would you make the reports in PE Figures 10-1 and 10-2 “look better”? After you improve the design of the reports, explain why you make the changes you did.
2. What other reports do you think John would ask for, based on the data that would be available from Petrie’s customer loyalty system? Make a list. Then take the first two reports on your list and design how they would look.
3. Using the text as one source and what you can find on the Internet as another source, make a list of the 10 most important things to consider when designing reports.
4. Do you belong to any customer loyalty programs such as an airline’s frequent flyer program or a program at a national retailer? If not, maybe your parents or other relatives do. Take the monthly report that a loyalty program sends to customers.
Identify all of the data elements needed to create the report and use that information to create an E-R diagram.
Figure 10-1
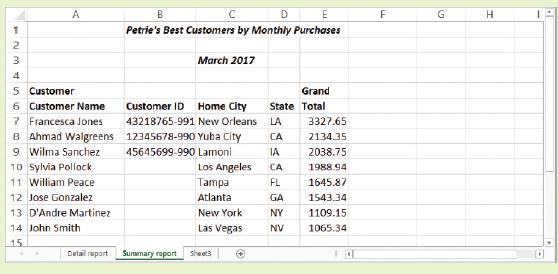
Figure 10-2
Step by Step Answer:


Modern Systems Analysis And Design
ISBN: 9780134204925
8th Edition
Authors: Joseph Valacich, Joey George
