

Estimate the area in each figure shown in Problems 39-46. -2 -1 YA 2 1 1 2x
Question:
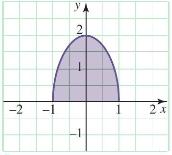
Estimate the area in each figure shown in Problems 39-46.
Fantastic news! We've Found the answer you've been seeking!
Step by Step Answer:

Answered By
Mario Alvarez
I teach Statistics and Probability for students of my university ( Univerisity Centroamerican Jose Simeon Canas) in my free time and when students ask for me, I prepare and teach students that are in courses of Statistics and Probability. Also I teach students of the University Francisco Gavidia and Universidad of El Salvador that need help in some topics about Statistics, Probability, Math, Calculus. I love teaching Statistics and Probability! Why me?
** I have experience in Statistics and Probability topics for middle school, high school and university.
** I always want to share my knowledge with my students and have a great relationship with them.
** I have experience working with students online.
** I am very patient with my students and highly committed with them
1+ Reviews
10+ Question Solved
Related Book For 

Question Posted:
