

JOURNAL PROBLEM The graph shown in Figure 14.42 is from the February 1991 issue of Scientific American.
Question:
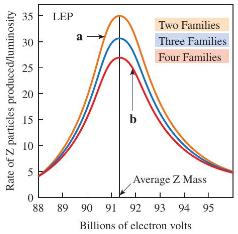
JOURNAL PROBLEM The graph shown in Figure 14.42 is from the February 1991 issue of Scientific American. If the curve in the middle is a standard normal curve, describe the variance of the upper curve (labeled
a) and then describe the variance of the lower curve (labeled b).
Figure 14.42
Step by Step Answer:

This question has not been answered yet.
You can Ask your question!
Related Book For 

Question Posted:
