

The SAT scores of entering first-year college students are shown in Figure18.21. In Problems 13-18, find the
Question:
The SAT scores of entering first-year college students are shown in Figure18.21. In Problems 13-18, find the average yearly rate of change of the scores for the requested periods.
Figure 18.21
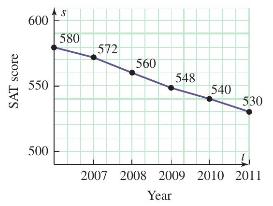
2006 to 2011
Fantastic news! We've Found the answer you've been seeking!
Step by Step Answer:

Answered By
Khurram shahzad
I am an experienced tutor and have more than 7 years’ experience in the field of tutoring. My areas of expertise are Technology, statistics tasks I also tutor in Social Sciences, Humanities, Marketing, Project Management, Geology, Earth Sciences, Life Sciences, Computer Sciences, Physics, Psychology, Law Engineering, Media Studies, IR and many others.
I have been writing blogs, Tech news article, and listicles for American and UK based websites.
5+ Reviews
17+ Question Solved
Related Book For 

Question Posted:
