

Question: outlier Effects. Consider the scatterplot in Figure 15. a. Which point is an outlier? Ignoring the outlier, estimate or compute the correlation coefficient for the
outlier Effects. Consider the scatterplot in Figure 15.
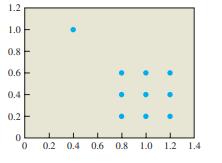
a. Which point is an outlier? Ignoring the outlier, estimate or compute the correlation coefficient for the remaining points.
b. Now include the outlier. How does the outlier affect the correlation coefficient? Estimate or compute the correlation coefficient for the complete data set.
29 1.2 1.0 0.8 0.6 0.4 0.2 0 0 0.2 0.4 0.6 0.6 0.8 1.0 1.2 1.4
Step by Step Solution
There are 3 Steps involved in it
1 Expert Approved Answer
Step: 1 Unlock

Question Has Been Solved by an Expert!
Get step-by-step solutions from verified subject matter experts
Step: 2 Unlock
Step: 3 Unlock