

Question: please help, this is all one question. Consider the scatter diagram in figure to the right. a. Which point is an outlier? Ignoring the outlier,
please help, this is all one question.
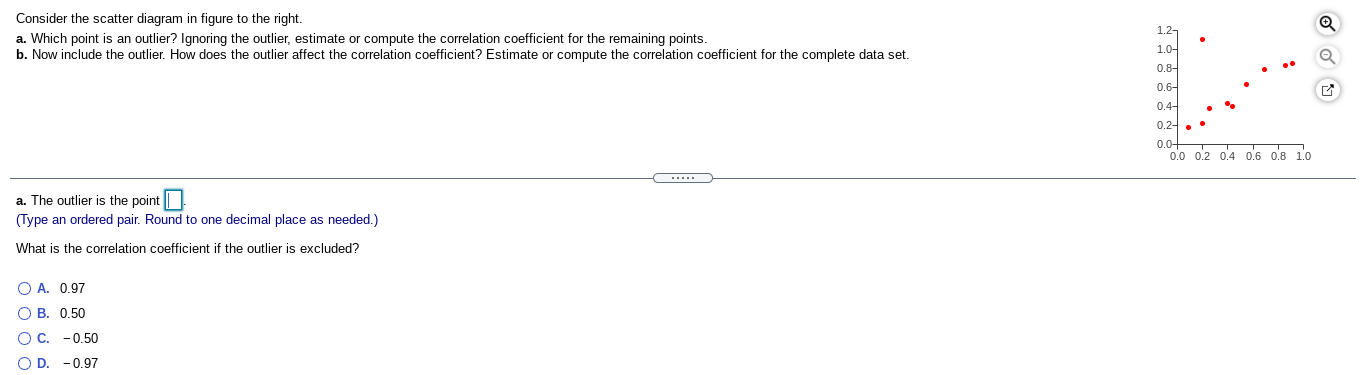

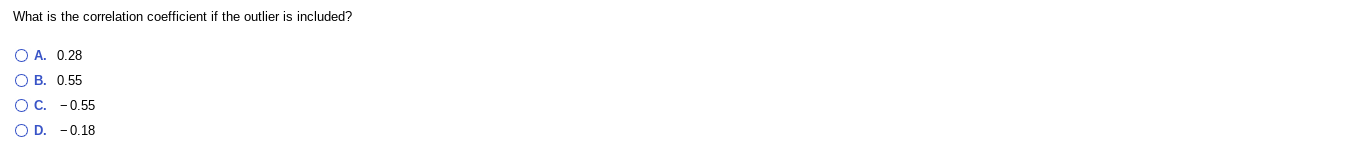
Consider the scatter diagram in figure to the right. a. Which point is an outlier? Ignoring the outlier, estimate or compute the correlation coefficient for the remaining points. 1.27 b. Now include the outlier. How does the outlier affect the correlation coefficient? Estimate or compute the correlation coefficient for the complete data set. 1.0- 0.8 0.6- 0.4- 0.2- 0.0 0.0 0.2 0.4 0.6 0.8 1.0 . . . . . a. The outlier is the point | (Type an ordered pair. Round to one decimal place as needed.) What is the correlation coefficient if the outlier is excluded? O A. 0.97 O B. 0.50 O C. - 0.50 O D. -0.97b. How does the outlier affect the correlation coefficient? O A. Including the outlier will increase the correlation coefficient. O B. Including the outlier will decrease the correlation coefficient. O C. Including the outlier will change the sign of the correlation coefficient. O D. Including the outlier will have no affect on the correlation coefficient.
Step by Step Solution
There are 3 Steps involved in it

Get step-by-step solutions from verified subject matter experts