

Question: Two-Day Forecast. Figure 8 shows a scatterplot in which the actual high temperature for the day is compared with a forecast made two days in
Two-Day Forecast. Figure 8 shows a scatterplot in which the actual high temperature for the day is compared with a forecast made two days in advance. Estimate the correlation coefficient and discuss what these data imply about weather forecasts. Do you think you would get similar results if you made similar diagrams for other two-week periods? Why or why not?
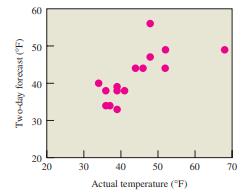
60 Two-day forecast (F) 30 40 50 20 20 20 20 30 40 50 Actual temperature ("F) 60 70
Step by Step Solution
There are 3 Steps involved in it
1 Expert Approved Answer
Step: 1 Unlock

Question Has Been Solved by an Expert!
Get step-by-step solutions from verified subject matter experts
Step: 2 Unlock
Step: 3 Unlock