

Question: Exercise 8.33 presents a scatterplot displaying the relationship between husbands' and wives' ages in a random sample of 170 married couples in Britain, where both
Exercise 8.33 presents a scatterplot displaying the relationship between husbands' and wives' ages in a random sample of 170 married couples in Britain, where both partners' ages are below 65 years. Given below is summary output of the least squares fit for predicting wife's age from husband's age.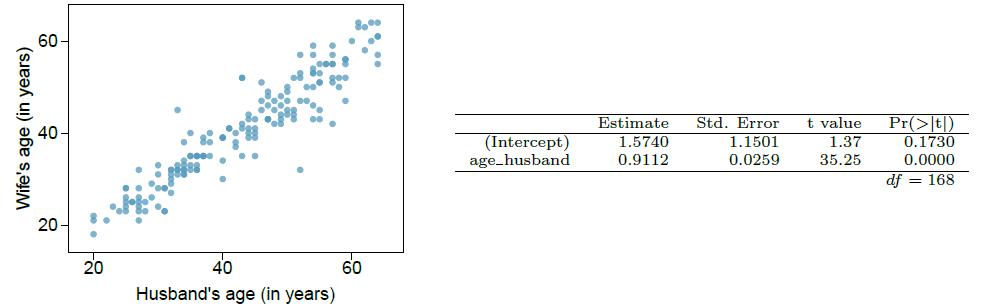
(a) We might wonder, is the age difference between husbands and wives consistent across ages? If this were the case, then the slope parameter would be β1 = 1. Use the information above to evaluate if there is strong evidence that the difference in husband and wife ages differs for different ages.
(b) Write the equation of the regression line for predicting wife's age from husband's age.
(c) Interpret the slope and intercept in context.
(d) Given that R2 = 0:88, what is the correlation of ages in this data set?
(e) You meet a married man from Britain who is 55 years old. What would you predict his wife's age to be? How reliable is this prediction?
(f) You meet another married man from Britain who is 85 years old. Would it be wise to use the same linear model to predict his wife's age? Explain.
Data from Exercise 8.33
The scatterplot below summarizes husbands' and wives' heights in a random sample of 170 married couples in Britain, where both partners' ages are below 65 years. Summary output of the least squares fit for predicting wife's height from husband's height is also provided in the table.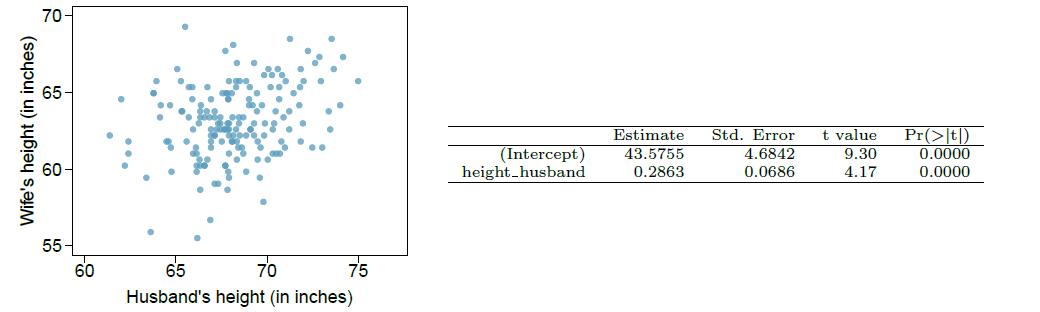
Wife's age (in years) 60- 20- 20 40 Husband's age (in years) 60 (Intercept) age_husband. Estimate Std. Error 1.5740 1.1501 0.9112 0.0259 t value 1.37 35.25 Pr(>|t|) 0.1730 0.0000 df 168
Step by Step Solution
3.35 Rating (170 Votes )
There are 3 Steps involved in it
Given the summary output for the least squares fit for predicting wifes age from husbands age lets address each part of the exercise as follows a To d... View full answer

Get step-by-step solutions from verified subject matter experts