

Question: The scatterplot shows the relationship between socioeconomic status measured as the percentage of children in a neighborhood receiving reduced-fee lunches at school (lunch) and the
The scatterplot shows the relationship between socioeconomic status measured as the percentage of children in a neighborhood receiving reduced-fee lunches at school (lunch) and the percentage of bike riders in the neighborhood wearing helmets (helmet). The average percentage of children receiving reduced-fee lunches is 30.8% with a standard deviation of 26.7% and the average percentage of bike riders wearing helmets is 38.8% with a standard deviation of 16.9%.
(a) If the R2 for the least-squares regression line for these data is 72%, what is the correlation between lunch and helmet?
(b) Calculate the slope and intercept for the least-squares regression line for these data.
(c) Interpret the intercept of the least-squares regression line in the context of the application.
(d) Interpret the slope of the least-squares regression line in the context of the application.
(e) What would the value of the residual be for a neighborhood where 40% of the children receive reduced-fee lunches and 40% of the bike riders wear helmets? Interpret the meaning of this residual in the context of the application.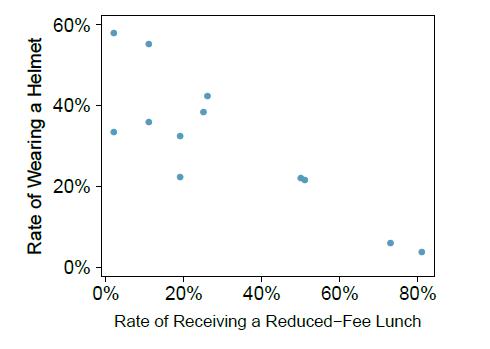
Rate of Wearing a Helmet 60% 40% 20% 0% 0% 20% 40% 60% 80% Rate of Receiving a Reduced-Fee Lunch
Step by Step Solution
3.39 Rating (155 Votes )
There are 3 Steps involved in it
Lets systematically address each part of the question using the given information and the scatterplot when necessary a The correlation r between the variables lunch and helmet is related to the coeffi... View full answer

Get step-by-step solutions from verified subject matter experts