

Question: 7.28 Helmets and lunches. The scatterplot shows the relationship between socioeconomic status measured as the percentage of children in a neighborhood receiving reduced-fee lunches at
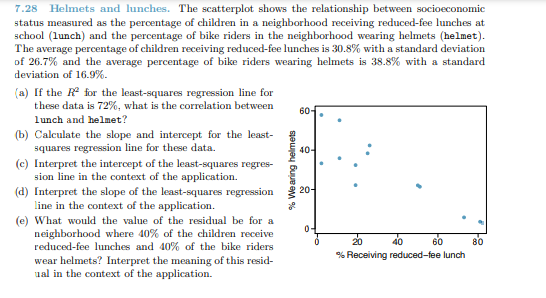
7.28 Helmets and lunches. The scatterplot shows the relationship between socioeconomic status measured as the percentage of children in a neighborhood receiving reduced-fee lunches at school (lunch) and the percentage of bike riders in the neighborhood wearing helmets (helmet). The average percentage of children receiving reduced-fee lunches is 30.8% with a standard deviation of 26.7% and the average percentage of bike riders wearing helmets is 38.8% with a standard deviation of 16.9%.
(a) If the R2 for the least-squares regression line for these data is 72%, what is the correlation between lunch and helmet?
(b) Calculate the slope and intercept for the leastsquares regression line for these data.
(c) Interpret the intercept of the least-squares regression line in the context of the application.
(d) Interpret the slope of the least-squares regression line in the context of the application.
(e) What would the value of the residual be for a neighborhood where 40% of the children receive reduced-fee lunches and 40% of the bike riders wear helmets? Interpret the meaning of this residual in the context of the application.
7.28 Helmets and lunches. The scatterplot shows the relationship between socioeconomic status measured as the percentage of children in a neighborhood receiving reduced-fee lunches at school (lunch) and the percentage of bike riders in the neighborhood wearing helmets (helmet). The average percentage of children receiving reduced-fee lunches is 30.8% with a standard deviation of 26.7% and the average percentage of bike riders wearing helmets is 38.8% with a standard deviation of 16.9%. (a) If the R- for the least-squares regression line for these data is 72%, what is the correlation between 60- lunch and helmet? (b) Calculate the slope and intercept for the least- Squares regression line for these data. 40- (c) Interpret the intercept of the least-squares regres- %% Wearing helmets sion line in the context of the application. (d) Interpret the slope of the least-squares regression 20- line in the context of the application. (e) What would the value of the residual be for a neighborhood where 40% of the children receive reduced-fee lunches and 40% of the bike riders 20 40 60 80 wear helmets? Interpret the meaning of this reside % Receiving reduced-fee lunch ual in the context of the application
Step by Step Solution
There are 3 Steps involved in it

Get step-by-step solutions from verified subject matter experts