

Question: Analyze the cost data below. What implications do these data suggest to managers? A $537,280 42% 45% 12% 1% Note: Figures represent percentages of quality
Analyze the cost data below. What implications do these data suggest to managers?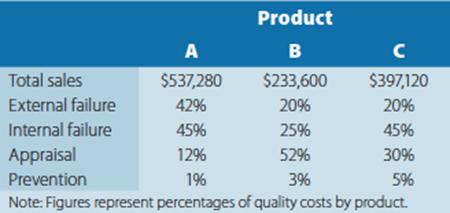
A $537,280 42% 45% 12% 1% Note: Figures represent percentages of quality costs by product. Total sales External failure Internal failure Product B $233,600 20% 25% Appraisal Prevention 52% 3% $397,120 20% 45% 30% 5%
Step by Step Solution
★★★★★
3.39 Rating (165 Votes )
There are 3 Steps involved in it
1 Expert Approved Answer
Step: 1 Unlock

Because quality costs are provided only in terms of percentages it is not possible to ... View full answer
Question Has Been Solved by an Expert!
Get step-by-step solutions from verified subject matter experts
Step: 2 Unlock
Step: 3 Unlock