

Question: The data shown below apply to the first two quarters of the current year. Using total-dollar measures of input and output, compare the total profit
The data shown below apply to the first two quarters of the current year. Using total-dollar measures of input and output, compare the total profit and productivity achieved for the two quarters. How does second-quarter productivity compare with the first-quarter productivity? Use partial-factor productivity to identify what might be done to improve productivity and profitability during the third quarter.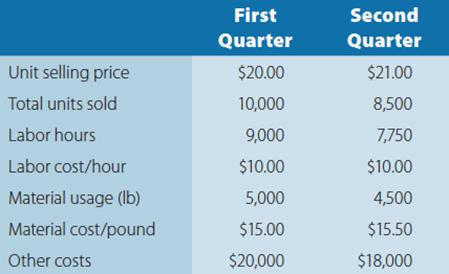
Unit selling price Total units sold Labor hours Labor cost/hour Material usage (lb) Material cost/pound Other costs First Quarter $20.00 10,000 9,000 $10.00 5,000 $15.00 $20,000 Second Quarter $21.00 8,500 7,750 $10.00 4,500 $15.50 $18,000
Step by Step Solution
3.40 Rating (169 Votes )
There are 3 Steps involved in it
First Quarter Output 2010000 200000 Input 109000 155000 20000 185000 P... View full answer

Get step-by-step solutions from verified subject matter experts