

Processing times for new accounts at a bank are shown in the following table. Five samples of
Question:
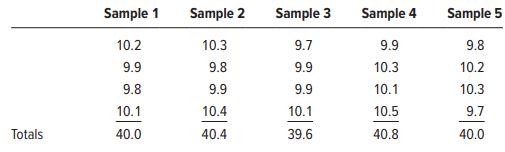
Processing times for new accounts at a bank are shown in the following table. Five samples of four observations each have been taken. Use the sample data in conjunction with Table 10.3 to construct upper and lower control limits for both a mean chart and a range chart. Do the results suggest that the process is in control?
Fantastic news! We've Found the answer you've been seeking!
Step by Step Answer:

Answered By
PALASH JHANWAR
I am a Chartered Accountant with AIR 45 in CA - IPCC. I am a Merit Holder ( B.Com ). The following is my educational details.
PLEASE ACCESS MY RESUME FROM THE FOLLOWING LINK: https://drive.google.com/file/d/1hYR1uch-ff6MRC_cDB07K6VqY9kQ3SFL/view?usp=sharing
3+ Reviews
10+ Question Solved
Related Book For 

Question Posted:
