

The example of the bullwhip effect shown in Table 13.4 shows how a simple 5 per cent
Question:
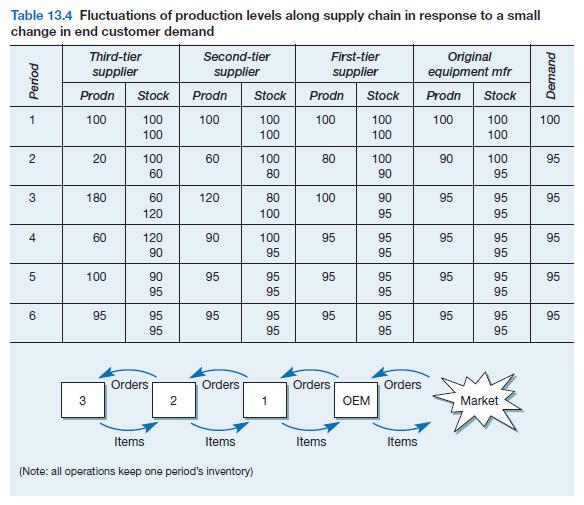
The example of the bullwhip effect shown in Table 13.4 shows how a simple 5 per cent reduction in demand at the end of supply chain causes fluctuations that increase in severity the further back an operation is placed in the chain.
(a) Using the same logic and the same rules (i.e. all operations keep one period’s inventory), what would the effect on the chain be if demand fluctuated period by period between 100 and 95? That is, period 1 has a demand of 100, period 2 has a demand of 95, period 3 a demand of 100, period 4 a demand of 95, and so on?
(b) What happens if all operations in the supply chain decide to keep only half of the period’s demand as inventory?
Step by Step Answer:
a If the demand fluctuated period by period between 100 and 95 Given the current behavior depicted in the table we can infer the following When there ...View the full answer


Operations Management
ISBN: 9780273708476
5th Edition
Authors: Nigel Slack, Stuart Chambers, Robert Johnston
