

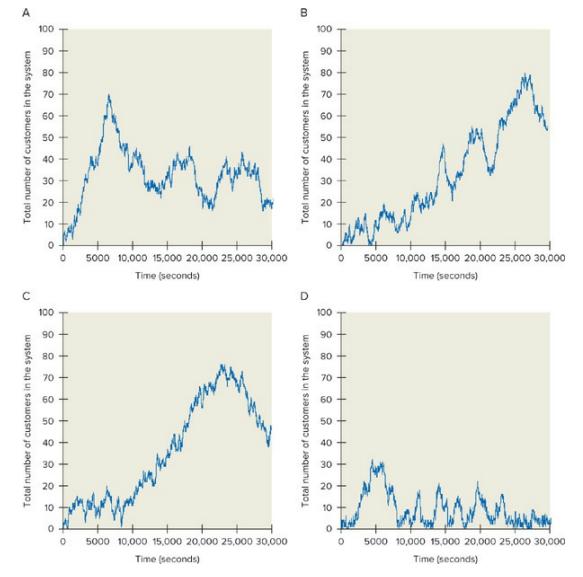
The following four graphs (Figure 16.15A, B, C, and D) display the number of customers in a
Question:
The following four graphs (Figure 16.15A, B, C, and D) display the number of customers in a queuing system (y-axis) over a long period of time (x-axis). Which of the following is most likely a stable system?
a. A
b. B
c. C
d. D
Fantastic news! We've Found the answer you've been seeking!
Step by Step Answer:
d Figure D The first three systems display ...View the full answer

Answered By
Sagar Kalane
I am post doctoral fellow in IISER Pune now. I am teaching assistant in Linear algebra course for ongoing semester. I was TA for many courses during PhD in IISER Mohali. Also I was visiting faculty in S.P.College Pune. I taught differential equation and algebra at that time. Before that I was taking home tuitions that’s why have good teaching experience.
0 Reviews
10+ Question Solved
Related Book For 

Operations Management
ISBN: 9781260547610
2nd International Edition
Authors: Gerard Cachon, Christian Terwiesch
Question Posted:
