

Question: You have been asked by your boss to make a presentation at the next management committee meeting on the methodology of work sampling and its
You have been asked by your boss to make a presentation at the next management committee meeting on the methodology of work sampling and its use in your machine shop. A consultant has recommended this method to management for use in estimating the proportion of nonproductive time for production equipment, such as a punch press. The committee members want an insider to brief them on this method. Sampling in real time is not possible during the meeting, so you decide to develop a chart that is a “virtual representation” of use of the punch press in the “real machine” shop. The chart will cover all time intervals during the five working days of the week. To develop this virtual representation of the actual operation, you ask an assistant to observe it each day of the week and record running, setup, idle, and breakdown times along a time line from 8:00 a.m. to 5:00 p.m. After making the observations, your assistant summarized the findings in a chart, as shown in Figure H.6. You intend to use this chart to simulate work sampling, thereby executing a work sampling plan in minutes that would normally take a week. You can then compare the proportions of time devoted to different activities estimated from the sample with the actual proportions and explain how to obtain estimates corresponding to any desired confidence level and within any specified maximum error.
a. Use a random number table to select 20 times during the week you will “observe” the punch press. Use a random number first to select the day and then use another random number to select the time of day. Omit the time period 12 p.m. to 1 p.m. each day because that is lunchtime, during which the machine will be shut down. Put these 20 times in an observation schedule.
b. Using your observation schedule, determine from Figure H.6 what the machine is doing at these times. Determine the sample proportion of the time spent in each category.
c. What are the actual proportions of time spent in each category from Figure H.6? How do they compare with the sample estimates?
d. Determine the sample size needed to ensure accuracy within ±4 percent with 95 percent confidence.
e. Based on your experiment, what can you tell management about sample sizes and the accuracy of the estimates?
Figure H.6
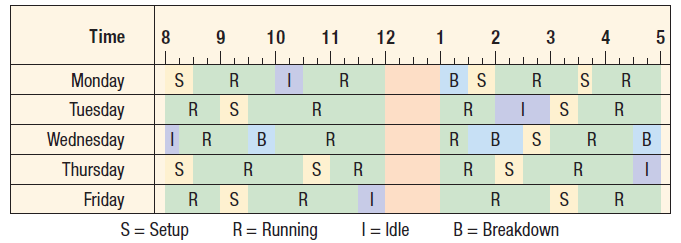
Time 3 2 10 11 12 4 B S R Monday R R Tuesday Wednesday Thursday R R R Friday S= Setup R = Running B = Breakdown %3D |= Idle 3.
Step by Step Solution
3.43 Rating (162 Votes )
There are 3 Steps involved in it
Machine shop work sampling a Because each day can be grouped into 32 15minute periods excluding lunch time the allocation of the 100 random numbers to ... View full answer

Get step-by-step solutions from verified subject matter experts