

Question: Consider a random variable X whose pdf is given by Use the ITM to generate observations from the distribution. This distribution, called a triangular distribution,
Consider a random variable X whose pdf is given by
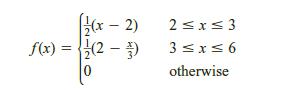
Use the ITM to generate observations from the distribution. This distribution, called a triangular distribution, is represented graphically in Figure 9. It has the endpoints [2, 6], and its mode is at 3. We can see that 25% of the area under the curve lies in the range of x from 2 to 3, and the other 75% lies in the range from 3 to 6. In other words, 25% of the values of the random variable X lie between 2 and 3, and the other 75% fall between 3 and 6. The triangular distribution has important applications in simulation. It is often used to represent activities for which there are few or no data. (For a detailed account of this distribution, see Banks and Carson (1984) or Law and Kelton (1991).)
(x-2) f(x)=(2- 0 2x3 3 x 6 otherwise
Step by Step Solution
There are 3 Steps involved in it

Get step-by-step solutions from verified subject matter experts