

The following table represents the variation in the number of waiting customers in a queue as a
Question:
The following table represents the variation in the number of waiting customers in a queue as a function of the simulation time.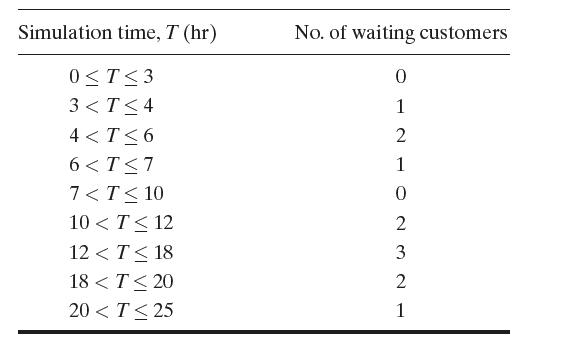
Compute the following measures of performance:
(a) The average length of the queue.
(b) The average waiting time in the queue for those who must wait.
Fantastic news! We've Found the answer you've been seeking!
Step by Step Answer:
a b Qlen 3 3...View the full answer

Answered By
Muhammad Umair
I have done job as Embedded System Engineer for just four months but after it i have decided to open my own lab and to work on projects that i can launch my own product in market. I work on different softwares like Proteus, Mikroc to program Embedded Systems. My basic work is on Embedded Systems. I have skills in Autocad, Proteus, C++, C programming and i love to share these skills to other to enhance my knowledge too.
1+ Reviews
10+ Question Solved
Related Book For 

Question Posted:
