

Question: (a) What are the final position values in Figures 2.3 and 2.4? (b) What values are obtained by subtracting the initial position value from the
(a) What are the final position values in Figures 2.3 and 2.4?
(b) What values are obtained by subtracting the initial position value from the final position value in each figure?
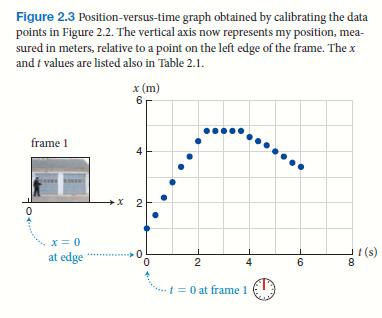
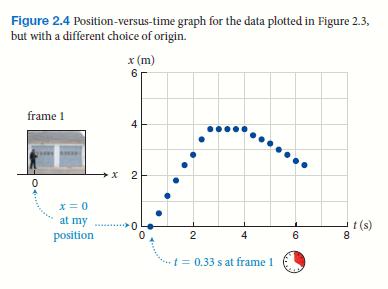
Figure 2.3 Position-versus-time graph obtained by calibrating the data points in Figure 2.2. The vertical axis now represents my position, mea- sured in meters, relative to a point on the left edge of the frame. The x and t values are listed also in Table 2.1. 0 x (m) 6 frame 1 4 x 2 x=0 at edge 0 2 t=0 at frame 1. t(s) 6 8
Step by Step Solution
3.45 Rating (158 Votes )
There are 3 Steps involved in it
a 34 mathrmm in Figur... View full answer

Get step-by-step solutions from verified subject matter experts