

Question: An ideal gas undergoes the process represented by the (P V) diagram of Figure P20.33, where the gas is in state 1 when the process
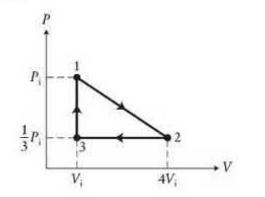
An ideal gas undergoes the process represented by the \(P V\) diagram of Figure P20.33, where the gas is in state 1 when the process begins and again in state 1 at the end of the process. Calculate the work done on the gas as a function of the initial pressure and volume.
Data from Figure P20.33
P P 13 4V 2 V
Step by Step Solution
★★★★★
3.49 Rating (156 Votes )
There are 3 Steps involved in it
1 Expert Approved Answer
Step: 1 Unlock

Question Has Been Solved by an Expert!
Get step-by-step solutions from verified subject matter experts
Step: 2 Unlock
Step: 3 Unlock