

Question: During a physics lab, you and your partner keep track of the position of a small cart while it is moving along a slope. The
During a physics lab, you and your partner keep track of the position of a small cart while it is moving along a slope. The lab instructions ask you to prepare \((a)\) a pictorial representation of the experiment, \((b)\) a table recording the position of the cart measured every 2. 00 seconds from its initial position, and \((c)\) a graph that shows the position of the cart on the vertical axis and time on the horizontal axis. You produce the sketch shown in Figure P1.34. What should your table and your graph look like?
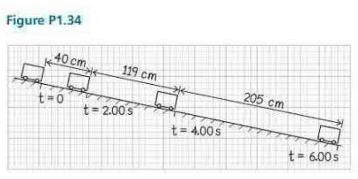
Figure P1.34 40 cm. 119 cm t=0 t-2.00s t=4.00s 205 cm t-6.00s
Step by Step Solution
3.45 Rating (164 Votes )
There are 3 Steps involved in it

Get step-by-step solutions from verified subject matter experts