

The graph in Figure P1.35 shows a relationship between two quantities: position (x), measured in meters, and
Question:
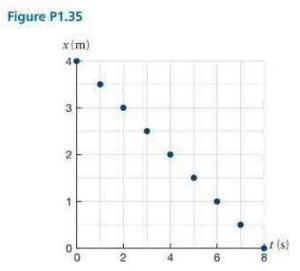
The graph in Figure P1.35 shows a relationship between two quantities: position \(x\), measured in meters, and time \(t\), measured in seconds. Describe the relationship using
(a) a verbal expression and \((b)\) a mathematical expression.
Step by Step Answer:

This question has not been answered yet.
You can Ask your question!
Related Book For 
Question Posted:
