

The diagram shows a sketch of the curve y = f(x), where The region R, shown in
Question:
The diagram shows a sketch of the curve y = f(x), where![]()
The region R, shown in the diagram, is bounded by the curve, the x-axis and the lines with equations x = 1 and x = 4. The table below shows the corresponding values of x and y with the y values given to 4 decimal places as appropriate.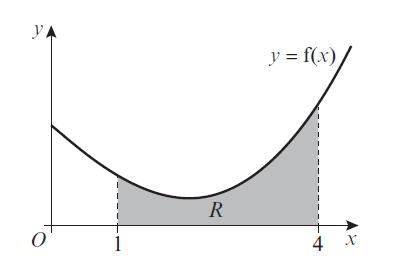

a. Complete the table with the missing value of y.
b. Use the trapezium rule, with all the values of y in the table, to obtain an estimate for the area of R, giving your answer to 3 decimal places.
c. Explain how the trapezium rule could be used to obtain a more accurate estimate for the area of R.
d. Show that the exact area of R can be written in the form a/b + c/d ln e , where a, b, c, d and e are integers.
e. Find the percentage error in the answer in part b.
Step by Step Answer:
a 09775 b 3074 c Use more values use s...View the full answer


Pearson Edexcel A Level Mathematics Pure Mathematics Year 2
ISBN: 9781292183404
1st Edition
Authors: Greg Attwood, Jack Barraclough, Ian Bettison, David Goldberg, Alistair Macpherson, Joe Petran
