

Question: Consider the phase diagram in Fig. 6.44, which represents a solidliquid equilibrium. Label all regions of the diagram according to the chemical species that exist
Consider the phase diagram in Fig. 6.44, which represents a solid–liquid equilibrium. Label all regions of the diagram according to the chemical species that exist in that region and their phases. Indicate the number of species and phases present at the points labelled b, d, e, f, g, and k. Sketch cooling curves for compositions xB = 0.16, 0.23, 0.57, 0.67, and 0.84.
Fig. 6.44
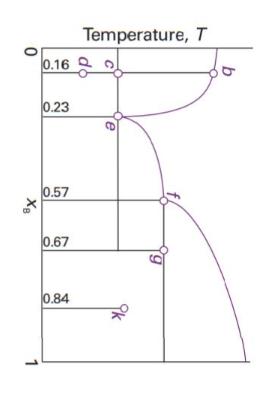
0 XB 0.16 0.23 0.57 0.67 0.84 Temperature, T b
Step by Step Solution
3.45 Rating (164 Votes )
There are 3 Steps involved in it
answer The number of species and phases present at each labeled point are Poin... View full answer

Get step-by-step solutions from verified subject matter experts