

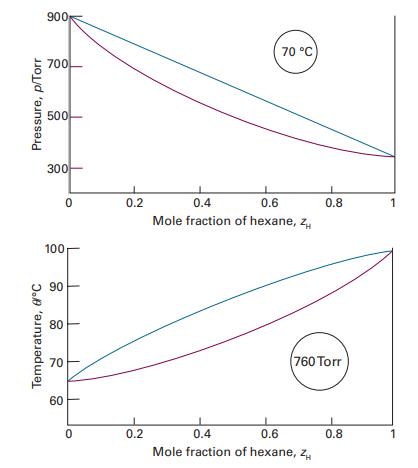
Figure 5.5 shows the experimentally determined phase diagrams for the nearly ideal solution of hexane and heptane.
Question:
Figure 5.5 shows the experimentally determined phase diagrams for the nearly ideal solution of hexane and heptane. (i) Label the regions of the diagrams to which phases are present. (ii) For a solution containing 1mol each of hexane and heptane molecules, estimate the vapour pressure at 70 °C when vaporization on reduction of the external pressure just begins. (iii) What is the vapour pressure of the solution at 70 °C when just one drop of liquid remains. (iv) Estimate from the figures the mole fraction of hexane in the liquid and vapour phases for the conditions of part b. (v) What are the mole fractions for the conditions of part c? (vi) At 85 °C and 760 Torr, what are the amounts substance in the liquid and vapour phases when zheptane=0.40?
Data in Figure 5.5
Step by Step Answer:
i In Figure 55 the regions of the diagrams to which phases are present are labeled as liquid p...View the full answer


Physical Chemistry Thermodynamics And Kinetics
ISBN: 9781464124518
10th Edition
Authors: Peter Atkins, Julio De Paula
