

Question: Redraw Figure 13.2 to show surfaces corresponding to both minimum and maximum values of the amplitude. Figure 13.2 2 12 2. -2 4.
Redraw Figure 13.2 to show surfaces corresponding to both minimum and maximum values of the amplitude.
Figure 13.2
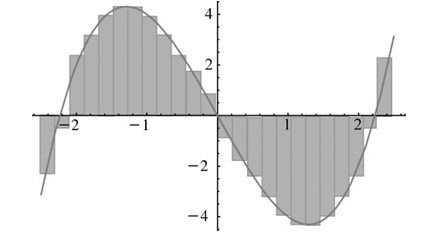
2 12 2. -2 4.
Step by Step Solution
★★★★★
3.38 Rating (176 Votes )
There are 3 Steps involved in it
1 Expert Approved Answer
Step: 1 Unlock

The figure will contain additional wa... View full answer
Question Has Been Solved by an Expert!
Get step-by-step solutions from verified subject matter experts
Step: 2 Unlock
Step: 3 Unlock