

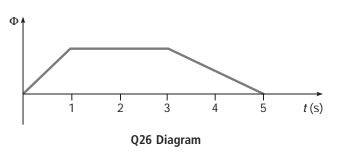
Suppose that the magnetic flux through a coil of wire varies with time, as shown in the
Question:
Suppose that the magnetic flux through a coil of wire varies with time, as shown in the graph. Using the same time scale, sketch a graph showing how the induced voltage varies with time. Where does the induced voltage have its largest magnitude? Explain.
Fantastic news! We've Found the answer you've been seeking!
Step by Step Answer:
FLUX ...View the full answer

Answered By
PALASH JHANWAR
I am a Chartered Accountant with AIR 45 in CA - IPCC. I am a Merit Holder ( B.Com ). The following is my educational details.
PLEASE ACCESS MY RESUME FROM THE FOLLOWING LINK: https://drive.google.com/file/d/1hYR1uch-ff6MRC_cDB07K6VqY9kQ3SFL/view?usp=sharing
3+ Reviews
10+ Question Solved
Related Book For 
Physics of Everyday Phenomena A conceptual Introduction to physics
ISBN: 978-0073512112
6th edition
Authors: W. Thomas Griffith, Juliet W. Brosing
Question Posted:
