

Question: FIGURE EX16.9 is the snapshot graph at t = 0 s of a longitudinal wave. Draw the corresponding picture of the particle positions, as was
FIGURE EX16.9 is the snapshot graph at t = 0 s of a longitudinal wave. Draw the corresponding picture of the particle positions, as was done in Figure 16.9b. Let the equilibrium spacing between the particles be 1.0 cm.
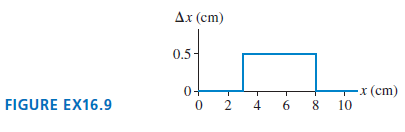
Ax (cm) 0.5- Tx(cm) FIGURE EX16.9 4 6 8. 10 2.
Step by Step Solution
★★★★★
3.36 Rating (165 Votes )
There are 3 Steps involved in it
1 Expert Approved Answer
Step: 1 Unlock

Visualize Figure EX169 shows a snapshot graph at t 0 s of a longitudinal wave T... View full answer
Question Has Been Solved by an Expert!
Get step-by-step solutions from verified subject matter experts
Step: 2 Unlock
Step: 3 Unlock