

Question: FIGURE Q33.1 shows light waves passing through two closely spaced, narrow slits. The graph shows the intensity of light on a screen behind the slits.
FIGURE Q33.1 shows light waves passing through two closely spaced, narrow slits. The graph shows the intensity of light on a screen behind the slits. Reproduce these graph axes, including the zero and the tick marks locating the double-slit fringes, then draw a graph to show how the light-intensity pattern will appear if the right slit is blocked, allowing light to go through only the left slit. Explain your reasoning.
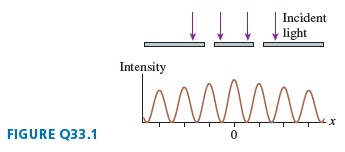
Incident light Intensity FIGURE Q33.1
Step by Step Solution
3.51 Rating (164 Votes )
There are 3 Steps involved in it
The initial light pattern is a doubleslit interference pattern It is centered be... View full answer

Get step-by-step solutions from verified subject matter experts