

FIGURE Q39.4 shows the dot pattern of electrons landing on a screen. a. At what value or
Question:
FIGURE Q39.4 shows the dot pattern of electrons landing on a screen.
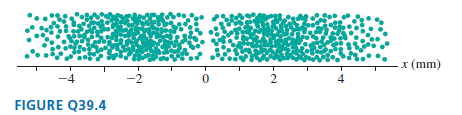
a. At what value or values of x is the electron probability density at maximum? Explain.b. Can you tell at what value or values of x the electron wave function ψ(x) is most positive? If so, where? If not, why not?
Fantastic news! We've Found the answer you've been seeking!
Step by Step Answer:
a The probability density is maximum at x 2 nm bec...View the full answer

Answered By
Utsab mitra
I have the expertise to deliver these subjects to college and higher-level students. The services would involve only solving assignments, homework help, and others.
I have experience in delivering these subjects for the last 6 years on a freelancing basis in different companies around the globe. I am CMA certified and CGMA UK. I have professional experience of 18 years in the industry involved in the manufacturing company and IT implementation experience of over 12 years.
I have delivered this help to students effortlessly, which is essential to give the students a good grade in their studies.
2+ Reviews
10+ Question Solved
Related Book For 

Physics for Scientists and Engineers A Strategic Approach with Modern Physics
ISBN: 978-0133942651
4th edition
Authors: Randall D. Knight
Question Posted:
