

Question: What distribution shape is represented by the histogram in Fig. 3.8.3 of volume (in thousands of units) by sales region? Fig. 3.8.3 40 30 20
What distribution shape is represented by the histogram in Fig. 3.8.3 of volume (in thousands of units) by sales region?
Fig. 3.8.3
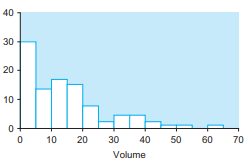
40 30 20 10 10 20 30 40 50 60 70 Volume
Step by Step Solution
★★★★★
3.39 Rating (171 Votes )
There are 3 Steps involved in it
1 Expert Approved Answer
Step: 1 Unlock

Skewed wi... View full answer
Question Has Been Solved by an Expert!
Get step-by-step solutions from verified subject matter experts
Step: 2 Unlock
Step: 3 Unlock