

Question: What distribution shape is represented by the histogram in Fig. 3.8.4 of hospital length of stay (in days)? Fig. 3.8.4 20- 10 10 20 30
What distribution shape is represented by the histogram in Fig. 3.8.4 of hospital length of stay (in days)?
Fig. 3.8.4
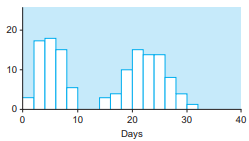
20- 10 10 20 30 40 Days
Step by Step Solution
★★★★★
3.45 Rating (177 Votes )
There are 3 Steps involved in it
1 Expert Approved Answer
Step: 1 Unlock

Question Has Been Solved by an Expert!
Get step-by-step solutions from verified subject matter experts
Step: 2 Unlock
Step: 3 Unlock