

Exercise 9 (page 171) gives data on the fuel consumption y of a car at various speeds
Question:
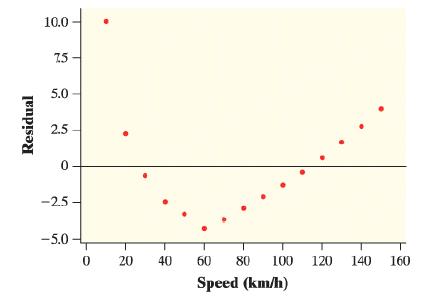
Exercise 9 (page 171) gives data on the fuel consumption y of a car at various speeds x. Fuel consumption is measured in liters of gasoline per 100 kilometers driven, and speed is measured in kilometers per hour. A statistical software package gives the least-squares regression line ŷ = 11.058– 0.01466x . Use the residual plot to determine if this linear model is appropriate.
Exercise 9
How does the fuel consumption of a car change as its speed increases? Here are data for a British Ford Escort. Speed is measured in kilometers per hour, and fuel consumption is measured in liters of gasoline used per 100 kilometers traveled.
Speed (km/h) ...................... Fuel used (L/100 km)
10 .................................................... 21.00
20 .................................................... 13.00
30 .................................................... 10.00
40 .................................................... 8.00
50 .................................................... 7.00
60 .................................................... 5.90
70 .................................................... 6.30
80 .................................................... 6.95
90 .................................................... 7.57
100 .................................................. 8.27
110 .................................................. 9.03
120 .................................................. 9.87
130 ................................................ 10.79
140 ................................................ 11.77
150 ................................................ 12.83
Step by Step Answer:
The residuals vs Speed predictor variable shows that residu...View the full answer


