

Here are some data on the hearts of various mammals: a. Make an appropriate scatterplot for predicting
Question:
Here are some data on the hearts of various mammals:
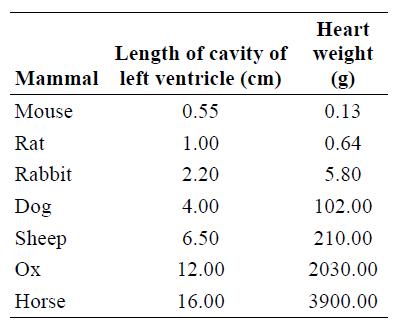
a. Make an appropriate scatterplot for predicting heart weight from length. Describe what you see.
b. Use transformations to linearize the relationship. Does the relationship between heart weight and length seem to follow an exponential model or a power model? Justify your answer.
c. Perform least-squares regression on the transformed data. Give the equation of your regression line. Define any variables you use.
d. Use your model from part (c) to predict the heart weight of a human who has a left ventricle 6.8 cm long.
Fantastic news! We've Found the answer you've been seeking!
Step by Step Answer:

Answered By
Issa Shikuku
I have vast experience of four years in academic and content writing with quality understanding of APA, MLA, Harvard and Chicago formats. I am a dedicated tutor willing to hep prepare outlines, drafts or find sources in every way possible. I strive to make sure my clients follow assignment instructions and meet the rubric criteria by undertaking extensive research to develop perfect drafts and outlines. I do this by ensuring that i am always punctual and deliver quality work.
6+ Reviews
13+ Question Solved
Related Book For 

Question Posted:
